Kubernetes for Adaptive AI Frameworks: Best Practices
Run adaptive AI reliably on Kubernetes: separate model serving, scale on GPU/latency, enforce RBAC/network policies, and monitor TTFT/ITL.
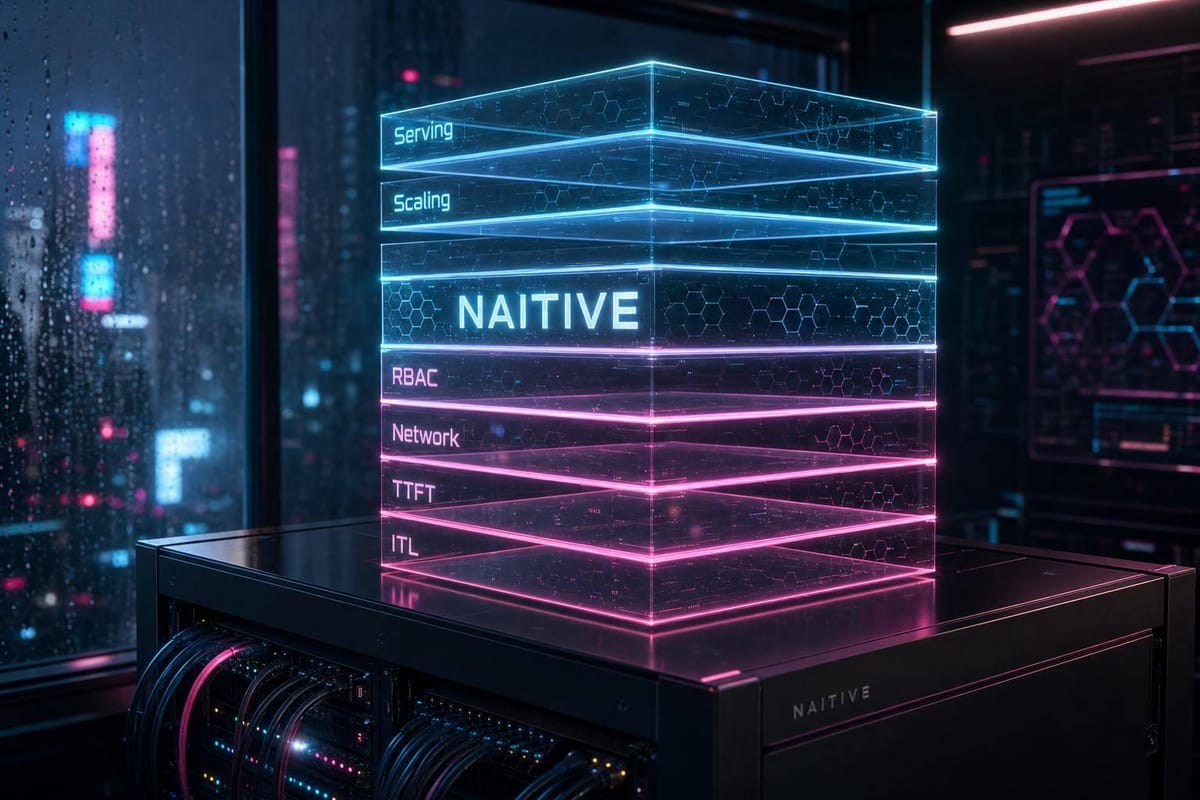
If you run AI agents in production, Kubernetes helps you split work, control GPU spend, and keep failures from spreading. In this piece, I’d boil the playbook down to a few moves: separate model serving from agent logic and data systems, scale on latency, GPU use, or queue depth instead of CPU, lock down identities and network paths, and treat prompts, models, and policies like code in Git.
Here’s the short version:
- Use clear lanes: keep GPU inference, CPU agent services, workflow engines, and stateful stores apart.
- Protect shared clusters: set namespaces, quotas, limits, priorities, and network rules per team or workload.
- Scale with the right signals: use p95 latency, GPU utilization, and queue depth; CPU alone can miss GPU pressure.
- Cut waste: use dedicated GPUs for strict SLAs, MIG for mixed tenants, and spot instances for checkpointed batch jobs.
- Watch the right metrics: track TTFT, ITL, p95/p99 latency, GPU memory, KV cache events, retries, and tool-call success.
- Roll out changes safely: use readiness checks, PDBs, shadow tests, and small canaries for model or prompt updates.
- Lock down agent access: use least-privilege service accounts, default-deny network policies, egress controls, mTLS, and signed images.
One stat stands out: 66% of teams running generative AI models already use Kubernetes for some or all inference work, and 90%+ expect growth in the next 12 months. So if I were moving from demos to production, I’d focus on one outcome: stable service at a cost I can explain.
This article lays out that path in plain terms, without treating AI like a normal web app.
Help! My LLM Is a Resource Hog: How We Tamed Inference With Kubernetes... Aditya Soni & Hrittik Roy
sbb-itb-f123e37
Design a Kubernetes Architecture for Adaptive AI Systems
Start with clear deployment lanes for model serving, agent control, and stateful data. Adaptive AI works best when these parts are split apart, not lumped onto the same nodes. Each lane has its own resource needs, update rhythm, and failure pattern. If you mix them together, you invite noisy-neighbor problems that can choke inference pods on I/O or network bandwidth.
Run model serving as separate stateless services. In practice, that means each model gets its own Kubernetes Deployment or KServe InferenceService on a dedicated GPU node pool. Add taints and tolerations so non-GPU workloads can't land there by accident. Keep agent workers and orchestration services on CPU node pools instead. They can pull tasks from message queues and call model endpoints through internal APIs.
Place workflow engines between those two lanes. They handle multi-step reasoning and retries without tying agent logic to any one model deployment. That matters when models change often. You don't want every agent service breaking just because one serving stack was updated.
Stateful systems need their own space too. Put vector stores, relational databases, and caches in separate namespaces, and give them tuned PVCs plus clear resource limits. This layered setup gives you room to scale GPU pods on their own, apart from agent workers. It also gives workflow logic a buffer, so model-serving failures can be caught and retried before they ripple upstream.
After you split the architecture, add namespace-level guardrails. Use one namespace per team or workload. That's not just tidy cluster hygiene. It stops one team's test agent from eating GPU capacity that a production service depends on.
Use controls like:
ResourceQuotasLimitRangesPriorityClassesNetworkPolicies- Pod Security admission
These controls help keep one team from knocking the cluster off balance. Production agent gateways, safety filters, and core model-serving deployments should get a high-priority class. Then, if the cluster is under pressure, Kubernetes can preempt lower-priority experimental pods instead of letting live services slow down.
Store model deployments, prompts, workflows, and RBAC policies as versioned YAML in Git, then reconcile them with Argo CD or Flux. Every change moves through a pull request, which gives you code review, automated checks, and a clean audit trail. You can see model versions, resource requests, and rollout strategies right in Git history.
Use ConfigMaps and Secrets for prompts, agent parameters, and API keys. For higher-level management, use CustomResourceDefinitions (CRDs) to define things like InferenceService or AgentClass. That gives teams a more structured way to manage AI workloads without hand-editing low-level objects every time.
And when a new model or agent behavior triggers a regression? Rollback is simple: revert the Git change. No manual cluster surgery. These boundaries make the next step much easier - setting the right GPU, CPU, and storage rules for each lane.
Manage Resources and Scale Without Wasting GPU Capacity
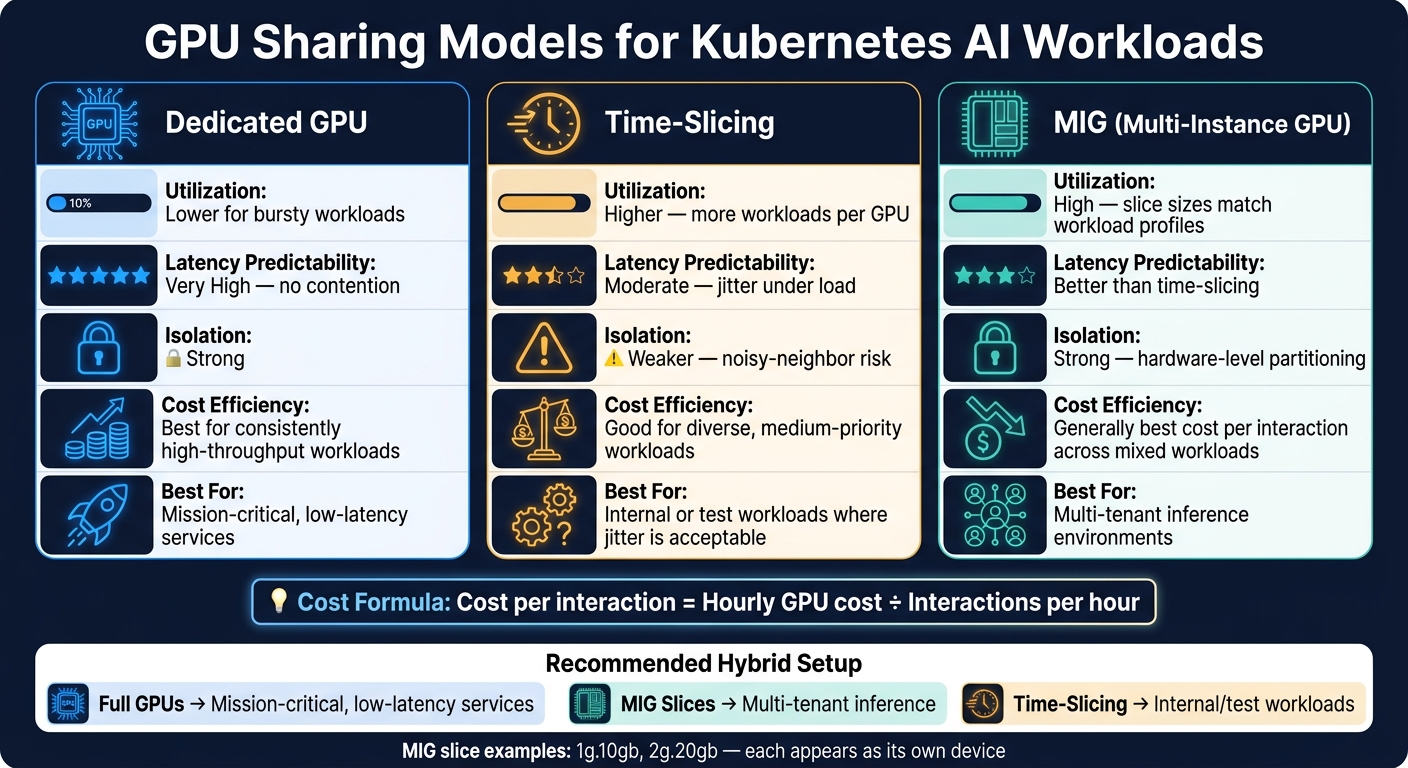
Kubernetes GPU Sharing Models: Dedicated vs Time-Slicing vs MIG Compared
Once workloads are split up, the next step is simple: keep GPUs busy without paying for idle cards. GPU placement, autoscaling, and sharing have a big effect on cost.
Schedule GPUs with Dedicated Node Pools, Labels, Taints, and Device Plugins
Kubernetes can’t schedule GPUs until the device plugin exposes them. In practice, that usually means installing the vendor plugin, most often NVIDIA's Kubernetes device plugin, and then requesting GPU capacity with nvidia.com/gpu: 1 in pod limits.
It also helps to split GPU infrastructure into separate node pools based on the kind of work each GPU handles. For example, you might use gpu-pool-a100 for high-throughput inference and gpu-pool-l4 for lighter jobs. From there, label nodes with tags such as accelerator=nvidia-gpu or a more specific label like nvidia.com/gpu.product=NVIDIA-A100-SXM4-80GB.
Then taint each GPU node with something like nvidia.com/gpu=present:NoSchedule. That way, only pods with the right tolerations can run there.
A minimal deployment spec for an LLM inference service looks like this:
apiVersion: apps/v1
kind: Deployment
metadata:
  name: llm-inference
spec:
  template:
    spec:
      nodeSelector:
        accelerator: nvidia-gpu
      tolerations:
      - key: "nvidia.com/gpu"
        operator: "Exists"
        effect: "NoSchedule"
      containers:
      - name: llm-server
        image: my-llm-image:latest
        resources:
          requests:
            nvidia.com/gpu: "1"
          limits:
            nvidia.com/gpu: "1"
You can also set GPU node pools to scale from zero, so nodes come online only when a GPU-marked workload needs them.
Once placement is dialed in, the next move is picking the right autoscaling signal.
Choose the Right Autoscaling Signals for Your Workloads
For GPU workloads, scale on GPU utilization, p95 latency, or queue depth - not CPU. CPU usage tells you very little about GPU saturation. If you scale on CPU alone, latency often climbs before the cluster responds.
The best signal depends on how the agent behaves:
- Interactive agent calls → scale on p95 latency with HPA and custom Prometheus metrics. If p95 moves above the target, add replicas and let the cluster autoscaler bring up more GPU nodes.
- Background agent queues → scale on queue depth with KEDA against sources like Kafka or Redis Streams.
- Model serving → scale on GPU utilization so the signal matches the hardware that is doing the work.
| Autoscaling Signal | Best Use Case | Strengths | Operational Limits |
|---|---|---|---|
| CPU utilization | CPU-bound microservices | Simple to configure, native HPA support | Misleading for GPU-bound inference; underreacts to saturation |
| Queue depth | Batch inference, agent task queues | Directly reflects workload backlog; pairs well with KEDA | Requires queue instrumentation; does not capture latency directly |
| GPU utilization | Online inference, model serving | Reflects actual hardware load; helps prevent over-provisioning | Needs Prometheus plus a DCGM exporter |
| p95/p99 latency | Latency-sensitive agents, real-time endpoints | Directly tied to user experience and SLAs | Requires careful threshold selection |
A simple rule of thumb works well here: use spot GPUs for batch jobs that can resume from checkpoints, and use on-demand GPUs for real-time inference.
If autoscaling still leaves cards sitting idle, the next thing to change is the sharing model.
Compare GPU Sharing Models Before Setting Cost Targets
The right sharing model depends on latency, isolation, and throughput. If you run mixed workloads with different SLA tiers, this choice has a direct effect on cost.
Dedicated GPUs give each pod a full physical GPU. That gives you steady latency and strong isolation, but it can leave a lot of idle time when traffic comes in bursts.
Time-slicing lets several pods share one GPU over time. That tends to lift utilization for small or on-and-off workloads, but it can introduce jitter when the card gets busy.
MIG (Multi-Instance GPU) splits one GPU into hardware-isolated slices such as 1g.10gb or 2g.20gb. Each slice appears as its own device. That gives you better latency control and stronger isolation than time-slicing, while still packing more workloads onto a single card.
| GPU Sharing Model | Utilization | Latency Predictability | Isolation | Cost Efficiency |
|---|---|---|---|---|
| Dedicated GPU | Lower for bursty workloads | Very high - no contention | Strong | Best for consistently high-throughput workloads |
| Time-slicing | Higher - more workloads per GPU | Moderate - jitter under load | Weaker - noisy-neighbor risk | Good for diverse, medium-priority workloads |
| MIG | High - slice sizes match workload profiles | Better than time-slicing | Strong - hardware-level partitioning | Generally best cost per interaction across mixed workloads |
Cost per interaction = hourly GPU cost ÷ interactions per hour.
A practical hybrid setup is to give full GPUs to mission-critical, low-latency services, use MIG slices for multi-tenant inference, and keep time-slicing for internal or test workloads where a little jitter is fine.
After capacity is tuned, latency and reliability become the next constraint.
Build for Low Latency, Reliability, and Full Observability
After GPU capacity is tuned, the next job is keeping adaptive AI systems fast and steady under production traffic.
Track the Metrics That Reflect Agent Performance
Standard web metrics don't tell the full story for agents. You need signals from the whole pipeline.
Track p50, p95, and p99 separately for end-to-end response time, time to first token (TTFT), and inter-token latency (ITL). TTFT shows how fast a user sees the response start. ITL shows how smoothly that response streams after it begins. For interactive workloads, a practical target is TTFT p95 ≤ 250–300 ms and TTFT p99 ≤ 800 ms.
A healthy system often stays within p99 ≤ 2.5× p95. If that ratio starts to stretch, that's usually a sign of contention, queue buildup, or GPU memory pressure somewhere in the path.
Latency is only part of it. Watch GPU memory utilization and KV cache usage too. KV cache exhaustion or fragmentation can trigger sudden latency spikes, so track eviction events and OOM counts as early warning signs. Queue depth, pod restarts, and throughput in tokens per second also matter because they help you spot a bottleneck before users feel it.
For agent reliability, instrument tool-call success rate, retry counts per interaction, and orchestration errors. These metrics tie straight to business SLAs such as task success rate, resolution rate, and average handle time (AHT). When p95 latency goes past 2,000 ms, resolution rates can fall, which makes it much easier to justify SLO violations when technical and business dashboards are connected.
Use these metrics as rollout gates for prompt and model changes.
Use Deployment Safeguards for Model and Prompt Changes
Model and prompt changes bring more risk than a normal code deploy. A tiny prompt tweak can shift agent behavior, and that shift may not show up until live users hit the system. Kubernetes gives you the tools to catch trouble early.
Readiness probes should confirm model load, tool reachability, and warmup before traffic is served. For LLM-serving pods, that means checking that the model is loaded into GPU memory, external tools are reachable, and warmup prompts finished without errors before the pod gets production traffic. Liveness probes help catch deadlocks and memory leaks during long inference runs, which lets Kubernetes restart stuck pods before users notice a hang. Pair that with PodDisruptionBudgets (PDBs) so a minimum number of model-serving replicas stay up during node drains or cluster maintenance.
For rolling updates, keep maxUnavailable low and set maxSurge high enough so new pods can pass readiness checks before old ones are shut down, especially when loading GPU memory takes time.
When choosing a rollout strategy, the best fit depends on how much risk you can accept and how closely you need to inspect the change:
| Strategy | Risk to Production Users | Validation Depth | Operational Complexity |
|---|---|---|---|
| Rolling | Medium - issues impact a growing portion of users as rollout progresses | Low–Medium - compares aggregate metrics over time | Low - built into Kubernetes deployments |
| Canary | Low - impact is limited to a small user subset | High - detailed metric and behavior comparison between versions | Medium - requires routing control and percentage-based traffic splitting |
| Blue-green | Medium–High - a full switch can propagate issues to all users, but rollback is fast | Medium–High - allows pre-switch testing and quick revert | High - needs duplicate environments and load balancer coordination |
| Shadow | Very Low - users only see responses from the stable version | Very High - supports offline analysis under real traffic | High - needs dual processing and extra GPU/CPU capacity |
Shadow deployments work especially well for prompt changes. Real traffic is mirrored to the candidate version, its responses are logged but not shown to users, and teams compare latency, token usage, and tool-call success under mirrored traffic before anyone is exposed. If shadow results hold up, a canary at 1–5% of live traffic gives you one more gate before full rollout.
Once a change is safe, the next lever is placement and batching.
Cut Latency Through Placement, Batching, and Workload Separation
With rollout guardrails in place, pod placement matters just as much as pod config. Co-locating model-serving pods with dependent services such as vector databases, embedding services, and agent orchestrators in the same availability zone cuts network hops on every request. That matters a lot for interactive web and voice workloads.
Use affinity to place tightly coupled services together, and anti-affinity to keep noisy neighbors apart. Topology-aware routing helps keep traffic zone-local and trims cross-zone latency.
Batching is one of the strongest ways to improve GPU inference throughput. When you group multiple requests into one GPU operation, tokens-per-second output goes up and per-request cost goes down. The tradeoff is queueing delay. Set a maximum wait time of 10–50 ms before forming a batch, and cap batch size based on the model's GPU memory footprint. For real-time endpoints, keep batches small and hold tight p95 targets. For background or offline endpoints, larger batches and looser latency budgets usually make sense. Continuous batching systems such as vLLM have shown about 2.2–2.3× better p99 latency and TTFT than older static batching methods.
Keep training and batch jobs off production inference node pools. Training workloads eat up GPU and I/O resources, and when they share node pools with real-time inference, the result is often contention that shows up as latency spikes during peak hours. Use priority classes and resource quotas so inference pods aren't preempted by background work. Also schedule large batch jobs during off-peak U.S. hours, when interactive traffic is lower.
Secure and Govern Autonomous AI Workloads on Kubernetes
Once scaling and observability are set, the next step is simple: lock down what agents can reach and what they can do.
AI agents can chain tool calls, query sensitive data, and kick off business actions. That means your security model has to deal with behavior that isn't always easy to predict.
Lock Down Identities, Permissions, and Container Runtime Behavior
Give each major part of the stack its own Kubernetes ServiceAccount. That includes agent orchestrators, model-serving pods, embedding services, and data access layers. Don't share accounts across workloads. Keep AI workloads limited to namespace-scoped Roles and RoleBindings instead of ClusterRoles.
Be strict here. Scope access to the agent's actual blast radius. If an orchestrator chains tool calls and triggers business actions, it should get access ONLY to those actions and nothing more.
When pods need to reach external systems, use workload identity or short-lived tokens instead of static keys. And if a pod doesn't need Kubernetes API access, turn off automatic service account token mounting.
At the container layer, lock things down with a few plain rules:
- Run containers as non-root
- Set
allowPrivilegeEscalation: false - Use
readOnlyRootFilesystemwhere it fits - Enforce the Restricted Pod Security profile
- Sign and verify images at admission
- Scan base images and model artifacts on a steady basis, whether they live in images or mounted volumes
- Apply seccomp profiles
- Use AppArmor or SELinux if your environment supports them
Control Network Paths, Data Access, and Outbound Tool Usage
Once identities are scoped, tighten network paths too.
Use default-deny NetworkPolicies for both ingress and egress in AI namespaces. Then allow only the traffic the workload needs: DNS, approved internal services, and the ports used by observability agents. That cuts lateral movement and shrinks the blast radius if an agent goes off script.
Send outbound agent traffic through an egress gateway or proxy. That layer should enforce domain allow-lists, logging, filtering, and rate limits for outside tools like payment, CRM, or ticketing APIs. Inside the cluster, use a service mesh with mTLS so service-to-service traffic is both authenticated and encrypted.
For data at rest, encrypt persistent volumes and object storage buckets that store model weights, vector indexes, prompt libraries, and config data with KMS-managed keys. Then limit read and write access with service-specific identities, so only the right pods and pipelines can touch the right data stores.
Autonomous agents also need explicit tool allow-lists by agent type. Add rate limits at both the API gateway layer and the business action layer. Pair Kubernetes audit logging with application logs so you can trace cluster actions and agent behavior during reviews or incidents. When something goes sideways, that trail matters.
| Control | Threat Mitigated |
|---|---|
| Namespace-scoped Roles and RoleBindings | Credential misuse, privilege escalation |
| Workload identity + short-lived tokens | Static credential theft, long-term key exposure |
| NetworkPolicies (default-deny) | Data exfiltration, lateral movement |
| Egress gateway + tool allow-lists | Unauthorized execution, runaway agent actions |
| mTLS (service mesh) | Man-in-the-middle attacks, unauthenticated service calls |
| Encrypted storage + RBAC on data | Sensitive data exposure, unauthorized model artifact access |
| Signed images + admission control | Supply chain attacks, tampered model containers |
| Audit logs | Incident forensics, compliance gaps |
Conclusion: Building an Operating Model That Keeps Adaptive AI Running in Production
With access paths and audit trails under control, production AI is much easier to govern.
The practices in this guide all point to the same idea: adaptive AI systems need clear structure at every layer. Separate model serving, agent logic, workflow control, and data access so each part can be secured and updated on its own. Instrument the cluster, the AI runtime, and outside tools so actions can be traced end to end. Enforce least-privilege identities, hardened containers, default-deny networking, and complete audit trails - then treat those controls as day-to-day operating discipline, not a one-time setup.
Teams that want help putting these patterns into practice can work with NAITIVE AI Consulting Agency, which focuses on AI consulting, autonomous AI agents, phone and voice autonomous agents, AI automation, and business process automation. They help businesses integrate AI effectively.
FAQs
When should I use MIG instead of dedicated GPUs?
Use MIG when you want lower costs through resource sharing. It splits one physical GPU into smaller, isolated instances, which is a good fit when several workloads don't need an entire GPU.
Use dedicated GPUs for high-demand tasks that need a single workload per GPU. In Kubernetes, MIG helps improve GPU use and cut idle capacity through bin packing and dynamic allocation.
What metrics matter most for scaling AI workloads on Kubernetes?
Focus on metrics across four layers:
- Platform: GPU utilization, framebuffer memory, PCIe bandwidth
- ML runtime: token throughput, inference latency, batch efficiency
- Kubernetes: pod restarts, pending pods, disk pressure
- Business: accuracy drift, cost per inference, SLA compliance
Taken together, these metrics show where the bottleneck lives: hardware, model performance, cluster stability, or business impact.
How do I secure agent access to tools and data in Kubernetes?
Use RBAC to match permissions to each agent’s role and clearance level. Pair that with a zero-trust model, so every interaction must pass authentication and authorization.
Also put data governance rules in place with data catalogs and role-based access standards. Protect data in transit with TLS, and connect enterprise identity and access management to your organization’s security policies.