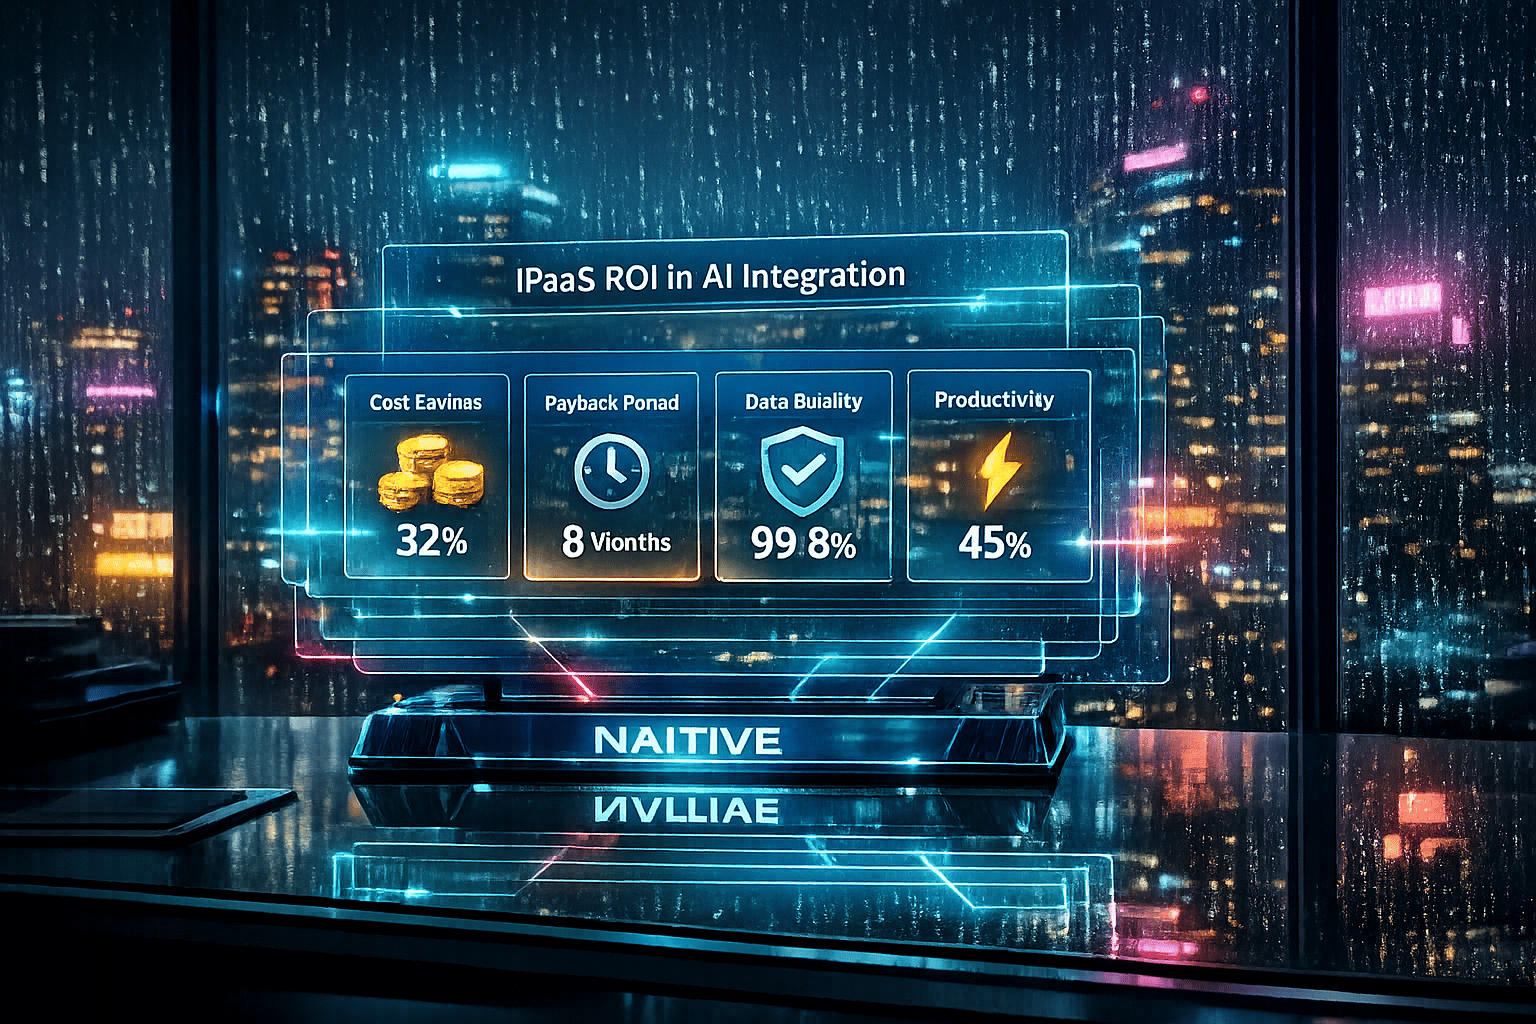
Key Metrics for iPaaS ROI in AI Integration
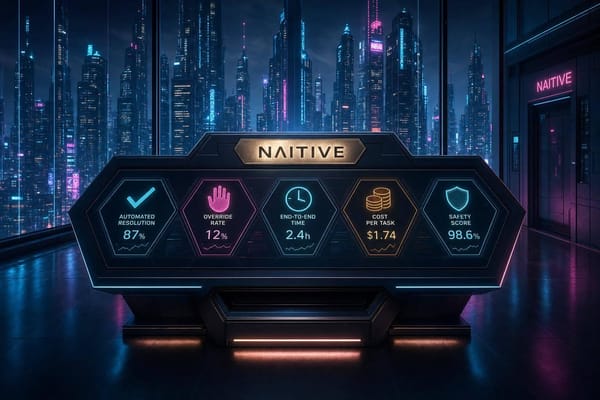
Practical iPaaS metrics for AI: cost savings, payback period, data quality, and productivity to quantify ROI.
Integrating AI into your business requires more than just choosing the right tools - it demands ensuring those tools work together efficiently. This is where iPaaS (Integration Platform as a Service) proves essential. By connecting applications, data, and processes in real-time, iPaaS eliminates the bottlenecks that often derail AI initiatives.
Why does this matter?
- 95% of IT leaders say integration issues hinder AI progress.
- 56% of CEOs report no ROI from AI investments, often due to disconnected systems.
- Without effective integration, 75% of AI projects fail to meet expectations.
iPaaS platforms simplify integration, reduce costs, and improve efficiency. They enable AI systems to work seamlessly with enterprise data, cutting task times dramatically and reducing errors by up to 95%. The result? Faster implementation, lower costs, and measurable business outcomes.
Key Takeaways:
- ROI Formula: (Output Value - Total Cost) ÷ Total Cost
- Savings Potential: Up to 90% reduction in manual labor and errors.
- Payback Period: Most AI projects recover costs in 3–8 months.
- Data Accuracy: Workflow success rates over 99% reduce costly mistakes.
iPaaS is not just a technical tool; it’s a financial strategy to ensure AI delivers measurable value. Whether cutting costs, improving workflows, or enabling faster decision-making, iPaaS is the backbone of successful AI integration.
How We Calculate the ROI of Our AI Solutions (Anatomy of an $80K AI Project)
sbb-itb-f123e37
Cost Savings Metrics
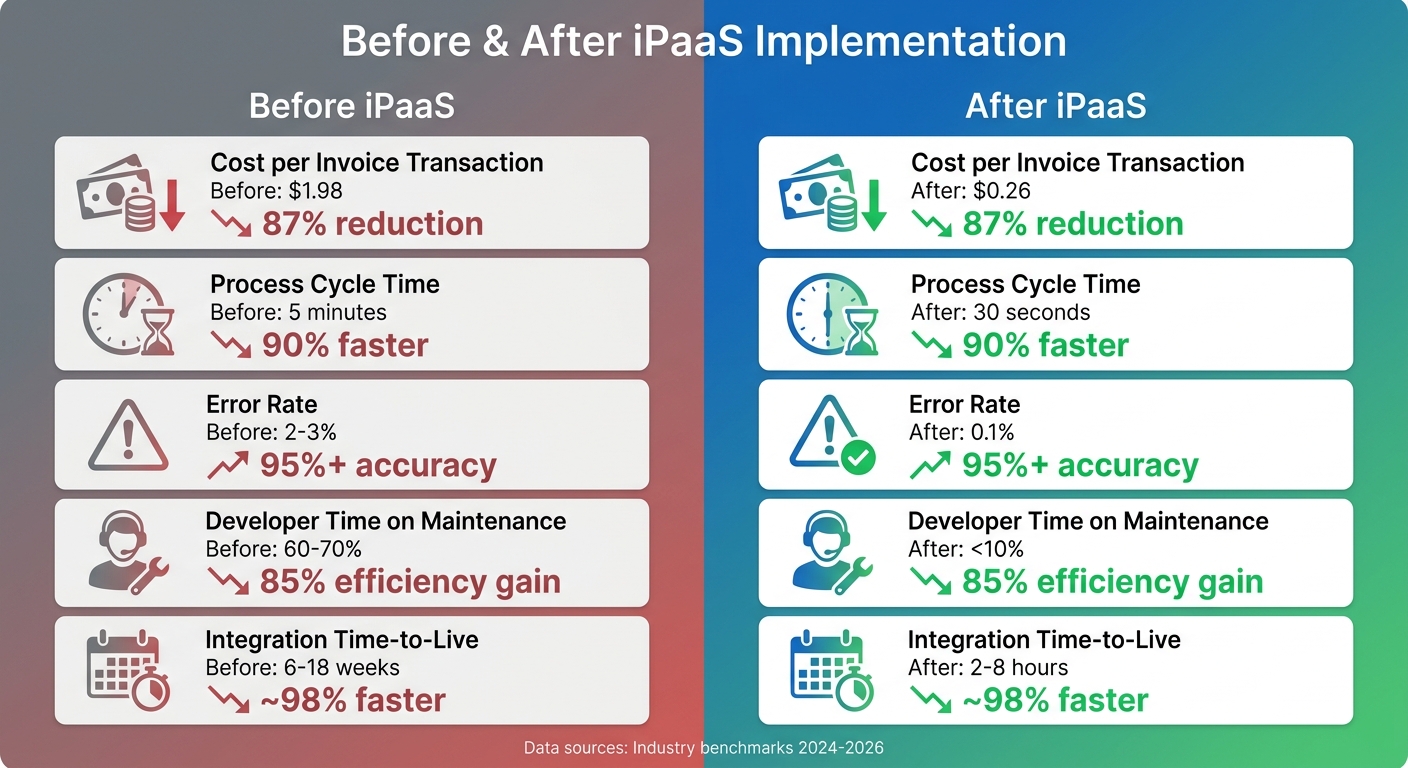
Before and After iPaaS Implementation: Cost and Performance Metrics Comparison
Building on the earlier discussion about ROI in AI integration, this section dives into how cost savings can be measured through direct reductions, improved workflows, and comparative analyses. These metrics highlight the financial benefits and pinpoint where the most impactful savings occur.
Savings extend beyond licensing fees, with reductions in labor costs, elimination of redundant software, and trimming down expensive maintenance tasks that often monopolize developer resources.
Direct Cost Reductions
One of the clearest areas of savings comes from automating repetitive tasks that were previously handled manually. A simple formula can help estimate baseline manual costs: (Annual Volume) × (Time per Task) × (Hourly Rate) × (FTE Utilization). This provides a clear picture of current spending levels.
Labor cost savings often take center stage. For instance, iPaaS platforms free up employee capacity by automating data-related tasks. A practical example? Automated invoice processing can slash labor time by over 90%.
"JPMorgan Chase implemented the 'COiN' AI system in 2017 to automate legal document review, reducing the contract review workload by 360,000 lawyer-hours per year."
–
Another major cost saver is reducing the need for specialist roles. Low-code iPaaS platforms empower operations teams to handle integrations, cutting reliance on expensive developers. Reallocating these roles can quickly lead to noticeable savings.
Optimizing software licensing is another area where costs drop significantly. Transitioning from older platforms with per-transaction pricing to modern iPaaS solutions with flat-rate pricing can save thousands of dollars monthly. Some platforms now start as low as $5 per month per automation. Additionally, iPaaS can help consolidate redundant software licenses, further trimming expenses.
"According to a Gartner analysis, organizations typically underestimate their total integration costs by 30-40%, because they focus on licensing while overlooking the full cost stack."
– Adil Mujeeb, CEO, eZintegrations
Operational Efficiency Gains
Beyond direct cost reductions, iPaaS improves workflow speed and accuracy. Automating manual processes drastically reduces cycle times. One case study showed a process cycle time shrinking from 5 minutes to 30 seconds, a 90% improvement.
Error reduction is another key benefit. Manual data entry often has a 2–3% error rate, while AI-enhanced systems with review capabilities achieve error rates as low as 0.1%. Fewer errors mean less money spent on correcting mistakes.
"Unilever deployed an AI-driven recruitment system for resume screening and initial interviews between 2024 and 2025. Over 18 months, the company achieved a 90% reduction in time-to-hire, saving over 50,000 hours of recruiter time and approximately $1 million in annual costs."
–
Lower maintenance demands also contribute to operational savings. In legacy systems, 60–70% of a developer's time is spent on maintaining integration flows instead of creating new ones. Modern platforms with reusable components can cut this figure to under 10%, freeing developers to focus on higher-value tasks.
However, it's worth noting the "learning curve tax." Teams often experience a 20–30% dip in productivity during the first few months as they adjust to new systems. Factoring this into projections ensures realistic expectations.
Before and After iPaaS Cost Comparison
A side-by-side analysis of costs before and after implementing iPaaS highlights the financial benefits. When calculating automated costs, include platform licensing, implementation, ongoing maintenance, and human review for exceptions. Use fully-loaded hourly rates (salary plus benefits and overhead, typically 1.25–1.35x multiplier) for accurate labor cost comparisons.
Don't forget to account for rework costs in your ROI formula: (Review Hours × Wage × Volume). Studies show that 37–40% of the time saved by AI may be offset by fixing low-quality output.
| Metric | Before iPaaS | After iPaaS | Improvement |
|---|---|---|---|
| Cost per Invoice Transaction | $1.98 | $0.26 | 87% reduction |
| Process Cycle Time | 5 minutes | 30 seconds | 90% faster |
| Error Rate | 2–3% | 0.1% | 95%+ accuracy |
| Developer Time on Maintenance | 60–70% | <10% | 85% efficiency gain |
| Integration Time-to-Live | 6–18 weeks | 2–8 hours | ~98% faster |
For example, a SaaS sales team used Zapier Pro ($50/month) to automate lead scoring and routing. With a one-week implementation costing $2,000, they saved 10 hours of manual work per month (valued at $3,000 annually). The payback period was just 1 month, and the team saw a 15% boost in close rates.
Most AI automation projects recover their costs within 6–12 months. By implementing a portfolio of automated processes, organizations can spread fixed costs across multiple use cases, amplifying their ROI.
These measurable savings set the stage for evaluating how AI integration impacts efficiency, data quality, and broader business outcomes.
Efficiency and Productivity Gains
After discussing cost savings, the next step in measuring ROI is to evaluate how AI integration through iPaaS impacts efficiency and employee productivity. These factors help determine whether AI-driven workflows genuinely improve operations or merely shift challenges to other areas.
Time Savings and Workflow Automation
One of the clearest indicators of efficiency is task completion time - the time it takes to finish a task. AI-powered workflows can dramatically reduce completion times, sometimes by as much as 90%. For instance, tasks like data entry often see time reductions of 85–95% with automation.
Another key metric is throughput, or the number of tasks completed in a given period. A sales team, for example, might increase its daily lead handling from 15 to 22 by using AI to handle research and preparation. Similarly, integration time-to-live, which refers to how quickly a solution can be implemented, is significantly faster with AI. While traditional iPaaS setups take 6–18 weeks, AI-enabled systems can be operational in as little as 2–8 hours.
AI also saves time for employees directly. Workers using generative AI report saving 2.2 hours per week, which translates to a 5.4% reduction in work hours. In customer service, AI integration often leads to a 30% cut in service costs.
These time savings create a ripple effect, paving the way for measurable improvements in employee productivity.
Employee Productivity Metrics
Metrics like FTE capacity freed measure how much workload is automated, allowing employees to focus on higher-value tasks. For example, a finance team might reduce its accounts payable staffing from 2.0 full-time equivalents (FTEs) to just 0.3. Another metric, expert time recovery, tracks how much time knowledge workers reclaim when routine tasks are automated. Traditional systems often demand excessive developer maintenance, but modern platforms reduce this to under 10%.
However, productivity gains aren’t without challenges. Rework costs, or the time spent fixing errors from AI outputs, can offset some of the benefits. Studies show that 37–40% of time saved by AI is often lost to correcting low-quality results. Even with these adjustments, mid-sized companies report 30–45% reductions in operational costs within the first year.
"37–40% of time saved is often lost to fixing low-quality output."
– Workday
Another measure of productivity is capacity creation, which reflects an organization’s ability to handle 15–25% more transactions without increasing headcount. These gains demonstrate how AI reshapes workflows, enabling teams to achieve more with less.
Payback Period for iPaaS Investments
The payback period answers a crucial question: How quickly will the investment pay off? The formula is straightforward: Total Investment ÷ Monthly Savings = Payback Period (months).
By 2026, many organizations report payback periods for AI-enabled iPaaS ranging from 3 to 8 months, with leading companies achieving ROI in just 4–6 months - a sharp improvement from the 18–24 month timelines common in 2023.
"The typical AI automation payback period has shortened dramatically, with leading organizations now achieving ROI in just 4–6 months, compared to the 18–24 month timelines common just three years ago."
– Agentic AI Solutions Team
Here are a couple of examples to illustrate this:
- A finance department reduced accounts payable staffing from 2.0 to 0.3 FTEs. With an $18,000 implementation cost and $6,600 in annual expenses, the team saved $145,400 in the first year, achieving a 1.4-month payback.
- An e-commerce retailer generating $50 million in revenue implemented AI-driven chatbots and voice solutions to handle 5,000 daily inquiries. With a $69,000 investment, the company realized $300,000 in annual benefits, achieving a 2.8-month payback and a 335% ROI.
High-volume, rules-based tasks like invoice processing and lead routing often see the fastest returns, sometimes within 1 to 2 months [9, 17]. Structured deployment frameworks can further accelerate time-to-value by 40%.
| Workflow Type | Typical Payback Timeline |
|---|---|
| Customer Communication | 1–2 weeks |
| Appointment Scheduling | 1–2 weeks |
| Invoice Processing | 3–6 weeks |
| Social Media Management | 4–6 weeks |
| Report Generation | 6–8 weeks |
When calculating the total investment, consider all expenses, including software licensing (usually $50,000–$150,000 annually for mid-market), one-time implementation costs ($75,000–$200,000), training and change management ($25,000–$75,000), and ongoing maintenance. Monthly savings are typically derived from reduced labor costs (factoring in fully loaded hourly rates at 1.3x–1.5x base wages), fewer errors, and recovered opportunity costs.
"AI automation for internal operations typically pays for itself in 3 to 6 months."
– Parker Gawne, Founder, Syntora
Data Quality and Integration Metrics
Efficiency and cost savings are important, but they mean little if your AI processes rely on poor-quality data. Data quality is the backbone of any successful AI integration, determining whether you achieve reliable results or face costly failures. In fact, 60% of AI projects fail because they lack sufficient "AI-ready" data.
Real-Time Data Synchronization
Real-time synchronization shifts decision-making from reactive to proactive. High-performing systems ensure data stays current within 4–8 hours and maintain latencies under 2 seconds, which helps reduce delays and manual errors significantly. Thanks to advancements in integration platforms, data processing speeds have improved by 67%, and falling inference costs - down 280x since late 2022 - have made real-time operations more accessible.
"The gap between successful and struggling AI implementations isn't primarily technological - it's measurement discipline."
– Promethium.ai
One key metric for executives is decision latency - the time it takes to act on incoming data. Real-time synchronization minimizes this lag by providing context and removing the need for manual data synthesis. This allows teams to respond to market shifts, customer demands, or operational issues within minutes instead of days.
Data Accuracy and Transformation
Once real-time synchronization is in place, the next priority is ensuring data accuracy for dependable AI outputs. A workflow success rate of over 99% is critical for system reliability. For AI-integrated data, two key measures are faithfulness (does the output align with source data?) and consistency across responses. Mature AI systems typically achieve 88–95% correctness on routine queries.
Reducing hallucination rates is equally important. Enterprise-grade Retrieval-Augmented Generation (RAG) systems can bring hallucinations down to under 1%, but this requires robust verification loops and Finetuning vs. RAG pipelines to anchor AI outputs in real-world data. Without these safeguards, AI risks generating plausible but incorrect information.
System performance benchmarks include 99.9% uptime as a standard. Automated integration can also cut data errors by up to 80% compared to manual processes. Before rolling out an iPaaS solution, document your baseline error rates over at least four weeks to accurately measure its impact.
| Metric Category | Key Metric | Target/Benchmark |
|---|---|---|
| Reliability | Workflow Success Rate | >99% |
| Reliability | System Uptime | 99.9% |
| Data Quality | Data Error Reduction | Up to 80% |
| Data Quality | Answer Correctness Rate | 88–95% |
| Synchronization | Latency | <2 seconds |
| Synchronization | Data Freshness | 4–8 hours |
"Model performance must serve the task, not just the benchmark."
– AIQ Labs
Set up alerts to notify you when a workflow's failure rate surpasses its baseline. This can prevent major downstream issues like data corruption. Additionally, monitor Cost Per Successful Task, which includes infrastructure, API fees, and oversight costs. Tracking this metric helps you understand the real economics of your data operations and how accuracy improvements translate into ROI.
Reusability of Integration Components
Long-term efficiency often comes from reusing integration components. API and component reusability can account for nearly 40% of the total value generated by advanced integration platforms. By building standardized APIs and modular architectures, you can reduce integration timelines from 9–18 months down to 3–6 months.
Reusable components save costs in multiple ways. They cut down development and testing time, as teams can deploy proven solutions instead of starting from scratch. This approach also simplifies maintenance - updates to shared components automatically improve all workflows that use them.
"Without granular cost tracking per client, per workflow, and per model, you are effectively subsidizing your clients' AI usage."
– Administrate
Track how many of your integrations rely on reusable components versus custom builds. Over time, your iPaaS implementation should shift heavily toward reuse. You should also monitor how often each API component is used across workflows - frequent reuse indicates you've built a flexible infrastructure that grows more valuable with each deployment. This modular strategy not only speeds up implementation but also strengthens overall system reliability.
Business Outcome Metrics
Measurable business outcomes are the ultimate benchmark for evaluating the return on investment (ROI) of iPaaS solutions. While operational metrics provide valuable insights, it's the tangible business results that confirm whether your investment is truly paying off.
Revenue and Profitability Metrics
Revenue attribution is a key differentiator between impactful AI deployments and surface-level experiments. For example, in the financial services industry, AI-driven decisions can account for 1% to 3% of total revenue. A standout case is JPMorgan Chase, which saved $1.5 billion through AI-powered fraud prevention, personalization, and operational efficiency.
AI integration also drives significant improvements in sales performance. Organizations report a 15–30% boost in lead-to-customer conversion rates, a 2–8% increase in average deal sizes, and up to a 10.3× ROI for AI-integrated processes, compared to just 3.7× for non-integrated ones.
"AI agents don't just do existing tasks faster - they enable capabilities that weren't previously possible."
– Snapsonic
Retention revenue is another critical metric, as it reflects reduced customer churn and sustained value. With 63% of companies adopting iPaaS to improve customer retention, quantifying the financial impact of reduced churn is essential. Similarly, throughput revenue - additional business capacity unlocked by automation - highlights the efficiency gains from AI integration.
Beyond boosting the bottom line, AI integration enhances customer engagement and satisfaction, reinforcing its value.
Customer Experience Improvements
Customer satisfaction metrics, such as Net Promoter Score (NPS) and Customer Satisfaction Score (CSAT), help gauge the impact of AI integration. For instance, companies have seen CSAT scores rise by 18% (from 4.0/5 to 4.7/5) following AI adoption. AI-driven retention strategies also reduce churn by up to 15%.
Real-world examples further demonstrate these benefits. Sutton Tools used conversational AI to automate 77% of price and availability inquiries, saving 24 hours of agent time in just one month. Similarly, BuyaCar reduced call abandonment rates by 33% by deploying AI agents for inbound queries. Other notable improvements include faster process cycle times, such as reducing loan approval timelines from 15 days to under 24 hours, and the ability to provide 24/7 service through AI-integrated iPaaS.
First-Contact Resolution (FCR) is another important metric, reflecting both efficiency and customer satisfaction. High-performing systems aim for FCR rates of 70–80% and maintain answer accuracy rates of 88–95% for routine queries. However, measuring AI's business impact remains a challenge for 59% of executives, emphasizing the importance of establishing clear baselines through AI consulting before implementation.
When combined, financial and quality metrics offer a complete picture of AI-driven ROI.
Financial vs. Non-Financial Metrics Comparison
A balanced approach to evaluating iPaaS ROI involves analyzing both financial and non-financial indicators:
| Metric Category | Financial Indicators | Non-Financial Indicators |
|---|---|---|
| Customer Impact | CLV and Retention Revenue | NPS, CSAT (70–80% benchmark) |
| Efficiency | ROI %, Payback Period, Labor Cost Reduction (25–80%) | Error Rate Reduction (up to 85%), Task Completion Rate |
| Growth | Incremental Revenue, Average Deal Size (+2–8%) | Lead Conversion Rate (+15–30%), Pipeline Velocity |
| Project Delivery | Integration Development Cost, Maintenance TCO | Time-to-Production (3 months median), Development Cycle Reduction (30%) |
"72% of AI initiatives destroy value because organizations can't measure ROI."
– Promethium.ai
When analyzing time savings, it's important to account for potential rework. Around 40% of the time saved through AI may be offset by error correction and verification. To isolate AI's contribution, consider using control groups - comparing teams using AI-integrated iPaaS with those relying on traditional methods. Most AI automation projects deliver measurable results within 3 to 6 months, though more complex predictive models may take over a year.
Tracking these metrics consistently reveals a clear trend: companies excelling in AI adoption are 3.5 times more likely to report that AI enables employees to focus on creative, high-value tasks.
Implementation and Monitoring Best Practices
Tracking the ROI of iPaaS requires a methodical approach. Without proper measurement frameworks, even successful AI initiatives can seem ambiguous, which is why many organizations struggle to showcase clear value.
Establishing Baseline Metrics
Before rolling out any iPaaS solution, it’s crucial to establish baseline metrics in three key areas: financial performance (like cost per task), operational efficiency (cycle times and error rates), and strategic capabilities (such as innovation speed). Organizations that use structured ROI frameworks report 5.2 times greater confidence in their AI investments compared to those that don’t.
Start by auditing your current AI and integration-related spending during the first two months. This audit helps uncover hidden costs - often 40–60% higher than initial estimates. Instead of trying to measure everything at once, focus on two or three priority business functions. For instance, if you’re automating invoice processing, track 30–60 days of pre-automation data, including manual processing times, error rates, and fully loaded labor costs.
To calculate Total Cost of Ownership (TCO), account for overlooked expenses like compliance reviews, model retraining, scaling, and coordination. Set up mechanisms to centralize data collection by linking AI platforms, business systems, and financial databases into a single reporting framework. Define specific outcome metrics, such as hours saved per task, error reduction percentages, or increased workload capacity without added resources.
"Simple payback math no longer works for compounding AI systems." – Elton Chan, Co-Founder, Second Talent
Tracking five core metrics - time savings, error reduction, throughput, decision velocity, and resource reallocation - can lead to a 34% efficiency boost within 18 months, compared to just 12% for those monitoring fewer than three.
Once baselines are established, you can effectively measure performance improvements.
Before and After Implementation Comparisons
Monitoring success requires evaluating five dimensions: Model Quality, System Quality, Business Impact, User Adoption, and Responsible AI. AI systems should meet baseline expectations, such as 99.9% uptime and response times under 2 seconds.
Real-time dashboards are essential for tracking metrics like agent success rates, prompt accuracy, and task completion rates. For example, TechHire Solutions, a recruiting agency, piloted AI-powered job application automation for three months. They saved 180 hours per month (a 72% reduction) and reduced errors by 87%, achieving an annual ROI of $94,800.
To ensure consistent results, implement dual RAG (Red-Amber-Green) pipelines and anti-hallucination checks for factual accuracy. A hybrid "Human-in-the-loop" (HITL) model can further improve long-term accuracy and user trust through real-time corrections. Schedule formal audits 90 days after implementation, followed by semi-annual reviews to address any performance drift.
Use the ROI formula:
[(Total Gains - Total Costs) / Total Costs] × 100.
Most AI automation projects recover costs within 3–6 months. If your payback period exceeds 12 months, it’s worth re-evaluating the use case. Keep in mind that initial implementation costs typically account for only 40–60% of the total AI investment over its lifecycle.
Working with Expert Consulting Services
Crafting a robust iPaaS measurement strategy often requires expertise in both AI technologies and business process optimization. Many organizations struggle to align technical capabilities with measurable business outcomes, making expert consulting invaluable.
NAITIVE AI Consulting Agency (https://naitive.cloud) specializes in creating tailored iPaaS strategies that integrate seamlessly into existing systems. Their focus is on building autonomous AI agents and automation solutions that deliver measurable results. By combining technical engineering with practical business insights, they prioritize client outcomes.
Expert consultants help ensure that performance metrics align with business goals, avoiding common pitfalls like unrealistic baselines or misaligned measurements - which contribute to the failure of 70% of AI initiatives. They can also assist with centralizing data, chaining tasks with logic layers, and implementing safeguards for sensitive operations.
A phased implementation framework might look like this:
- Months 1–2: Establish baseline cost tracking.
- Months 3–4: Define metrics and set up data collection.
- Months 5–6: Perform initial ROI calculations.
- Months 7–12: Expand measurement to additional use cases.
This structured approach transforms AI from a speculative investment into a proven tool for driving competitive advantage.
Conclusion
Measuring iPaaS ROI is the key to separating game-changing AI initiatives from those that drain resources. The metrics outlined in this guide - like reduced transaction costs, fewer errors, and quicker payback periods - highlight the tangible value iPaaS can bring to organizations.
As discussed earlier, tracking measurable outcomes in cost, efficiency, and quality demonstrates how integrating AI through iPaaS delivers real results. Companies that adopt structured frameworks to monitor financial and operational benefits often see impressive returns, such as 20–40% gains in automation rates and significant improvements in data accuracy. However, with 59% of executives admitting difficulty in evaluating the business impact of AI, having a clear, structured approach is more important than ever.
iPaaS also addresses hidden expenses and drastically shortens integration timelines. For example, in 2025, Danfoss implemented an AI-driven email classification system that autonomously managed 80% of incoming emails. This innovation reduced average response times from 4.2 hours to just 12 minutes.
Adopting a portfolio approach to AI integration - rather than treating projects as isolated efforts - can amplify returns. By spreading platform costs across multiple high-volume workflows like invoicing, onboarding, and lead scoring, organizations can maximize ROI. These collective benefits align seamlessly with the broader strategies detailed earlier, proving AI's business impact.
FAQs
Which ROI metrics matter most for iPaaS-enabled AI?
Key ROI metrics for iPaaS-enabled AI focus on areas like cost savings, time reductions, revenue gains, payback period, and efficiency improvements. These metrics provide a clear way to assess the financial and operational benefits of integrating AI into iPaaS solutions, helping businesses track measurable outcomes.
How do I calculate payback period for AI + iPaaS?
To figure out the payback period for AI and iPaaS investments, use this formula: Payback Period (months) = Total Investment / Monthly Savings. Start by calculating your total investment, which includes expenses like licensing fees and setup costs. Then, estimate your monthly savings - this could come from reduced labor costs or fewer operational errors. Divide the total investment by the monthly savings to determine how many months it will take to recover your initial costs. Generally, businesses target a payback period of 3 to 6 months.
What data quality KPIs should I track for AI workflows?
To measure the effectiveness and reliability of your AI workflows, focus on these key metrics:
- Error Rates: Track how often mistakes occur in AI outputs. Lower error rates indicate better performance.
- Rework Frequency: Monitor how often outputs need to be corrected or redone. Frequent rework can signal underlying issues in the workflow.
- Exception Handling: Evaluate how well the system manages unexpected scenarios or anomalies.
- Accuracy Improvements: Measure progress in output precision over time, reflecting how well the system adapts and improves.
These KPIs are essential for assessing performance and identifying areas where your AI processes can be fine-tuned for better results.