Scaling AI Monitoring with Container Orchestration
Compare Kubernetes and Docker Swarm for AI monitoring—autoscaling, GPU support, observability, costs, and best-use scenarios.

AI monitoring is complex, especially with unpredictable workloads. Kubernetes and Docker Swarm are two popular tools for managing and scaling AI systems. Here’s the key takeaway: Kubernetes excels in handling large-scale, enterprise-level AI deployments with features like auto-scaling, GPU management, and advanced monitoring integrations. Meanwhile, Docker Swarm offers a simpler, lightweight option suitable for smaller teams or projects. For organizations needing specialized guidance, AI consulting services can help navigate these architectural choices.
Key Points:
- Kubernetes: Handles large-scale AI with advanced features like Horizontal Pod Autoscaler (HPA), GPU management, and AI-specific tools like Prometheus and OpenTelemetry.
- Docker Swarm: Easier to set up, ideal for smaller teams, but lacks native auto-scaling and requires manual configurations for advanced AI workloads.
- Monitoring Needs: Both platforms can integrate with tools like Prometheus and Grafana, but Kubernetes provides deeper observability across infrastructure and AI performance layers.
Quick Comparison:
| Feature | Kubernetes | Docker Swarm |
|---|---|---|
| Auto-scaling | Native (HPA, custom metrics) | Manual or custom scripts |
| Complexity | High (steep learning curve) | Low (simple for Docker users) |
| Node Scalability | 5,000+ nodes | ~1,000 nodes |
| GPU Support | Native (NVIDIA GPU Operator) | Manual configuration |
| Annual Cost | $50,000–$300,000 | $20,000–$50,000 |
Bottom Line: Choose Kubernetes for enterprise AI systems requiring scalability and advanced features. Opt for Docker Swarm if simplicity and lower costs are priorities for smaller projects.
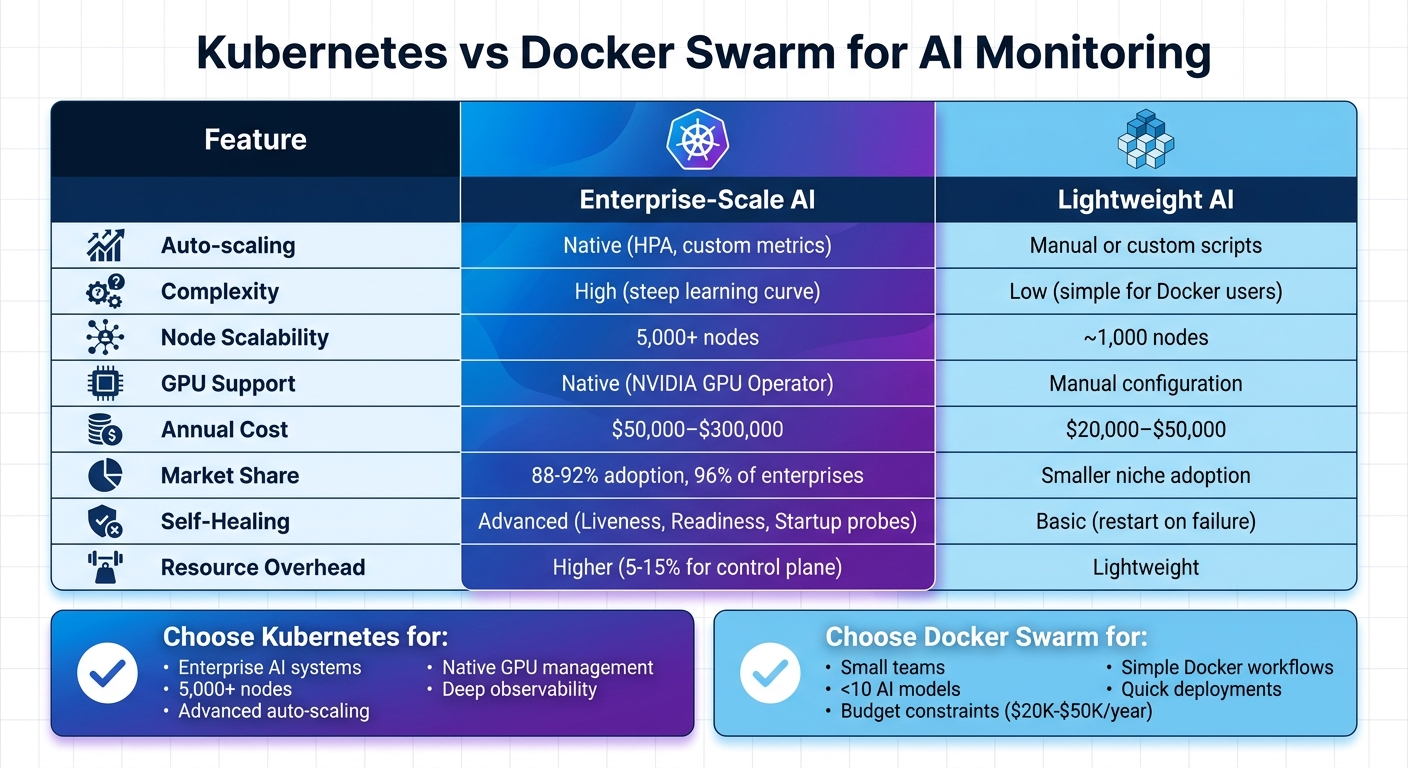
Kubernetes vs Docker Swarm for AI Monitoring: Feature Comparison
Building Massive-Scale Generative AI Services with Kubernetes and Open Source - John McBride
sbb-itb-f123e37
1. Kubernetes
Kubernetes has become the leading platform for managing AI workloads at scale, offering automation to handle the unpredictable resource demands that AI often brings.
Scalability Features
One standout feature is the Horizontal Pod Autoscaler (HPA). Unlike basic scaling methods that depend solely on CPU or memory usage, HPA can scale based on custom metrics like queue depth or latency. For instance, AI agents that spend most of their time waiting for API responses (with low CPU usage) benefit from scaling based on queue backlog instead of CPU. This approach prevents bottlenecks before they affect users.
ServiceMonitors from the Prometheus Operator play a key role in automating the discovery and scraping of metrics as AI pods scale up or down. Meanwhile, the Kubernetes AI Toolchain Operator (KAITO) simplifies the deployment and monitoring of large-scale AI models like Qwen and vLLM. It automates infrastructure provisioning and makes crucial metrics readily available.
To avoid resource contention among AI services, Kubernetes enforces resource quotas and limits, ensuring that no single service overwhelms the system or monitoring stack.
Monitoring Tool Integration
A robust monitoring stack is essential for AI workloads. The standard setup includes Prometheus for metrics collection, Grafana for visualization, and DCGM Exporter for NVIDIA GPU metrics. These are often deployed using the kube-prometheus-stack Helm chart.
For real-time monitoring, vLLM exposes Prometheus metrics by default, tracking token throughput and request performance. Additionally, OpenTelemetry provides a vendor-neutral framework for collecting traces, metrics, and logs across distributed AI systems.
Platforms like SRExpert and Neubird enhance traditional monitoring setups by adding an AI-driven layer. These tools analyze metrics, logs, and events to identify root causes automatically. As SRExpert Engineering explains:
"AI is a force multiplier. It handles triage, gathers context, correlates data, and surfaces probable root causes. It turns a 30-minute investigation into a 5-minute validation."
These tools enhance observability, offering insights that span from hardware performance to business outcomes.
Observability Enhancements
Kubernetes enables observability at every layer of the AI stack. Effective AI monitoring involves tracking three layers: Platform (e.g., GPU and node health), ML/Runtime (e.g., inference latency and throughput), and Outcome (e.g., model accuracy and cost). This layered approach ensures that both infrastructure and the business value of AI systems are monitored.
Distributed tracing is critical for AI agents performing multi-step workflows. For example, when an agent queries a vector database, accesses a large language model, and calls an external API, tracing helps pinpoint where delays occur. As cloud architect Luca Berton puts it:
"If you only measure total latency, you cannot distinguish between a slow model and a congested queue. Measure each component separately."
AI-driven monitoring is also moving from reactive to proactive. Instead of relying on static thresholds like "alert if CPU > 80%", modern systems learn workload-specific patterns to predict potential resource exhaustion. This shift can reduce on-call alerts by up to 70%.
AI-Specific Use Cases
Kubernetes is uniquely equipped to handle AI workloads by scaling and monitoring them with precision. For example, it excels in GPU resource management, tracking GPU memory pressure at both the device and pod levels. This prevents Out-of-Memory (OOM) errors during heavy inference or training sessions. Metrics like "Token Throughput" (tokens per second) and "Model Load Times" help ensure that generative AI applications meet performance expectations.
Kubernetes also supports distributed training through operators like TFJob for TensorFlow and PyTorch, allowing workloads to be spread across multiple nodes for faster training. Tools like KFServing, Seldon Core, and KAITO simplify the deployment and monitoring of inference runtimes for large language models.
| Metric Category | Key Metrics to Track | Use Case |
|---|---|---|
| Platform | GPU Utilization, FB Memory, PCIe Bandwidth | Ensure hardware is not a bottleneck |
| ML Runtime | Token Throughput, Inference Latency, Batch Efficiency | Measure model performance |
| Kubernetes | Pod Restarts, Pending Pod Count, Disk Pressure | Monitor cluster and workload stability |
| Business | Accuracy Drift, Cost per Inference, SLA Compliance | Connect infrastructure to business outcomes |
With the average Kubernetes deployment generating over 1,000,000 events and metrics per hour, and Gartner estimating IT downtime costs at $5,600 per minute, Kubernetes' monitoring capabilities are indispensable for keeping AI systems reliable and efficient at scale.
2. Docker Swarm
While Kubernetes is often the go-to for large-scale AI deployments, Docker Swarm offers a simpler, more lightweight alternative, especially suited for smaller AI monitoring setups. Its straightforward design makes it appealing to startups and teams with limited experience in orchestration.
Scalability Features
Docker Swarm doesn't have a built-in auto-scaling feature like Kubernetes' Horizontal Pod Autoscaler. Instead, scaling is a manual process, done through commands such as docker service scale or docker service update --replicas. Nawaz Dhandala, author of a Docker Swarm guide, highlights this limitation:
"Docker Swarm does not include built-in auto-scaling... This is a notable gap compared to Kubernetes, which has the Horizontal Pod Autoscaler."
For teams using Docker Swarm, automated scaling for AI workloads requires custom solutions. These are typically developed with Python or Shell scripts that interact with Prometheus metrics and the Docker API. In February 2026, Dhandala showcased a Python-based auto-scaler that monitored CPU usage to scale a "webapp" service between 2 and 10 replicas. The system included cooldown periods and thresholds: scaling up at 70% CPU usage and scaling down at 30%.
For AI agents, however, CPU usage isn't always the best metric. Queue depth often provides a more accurate picture, as Valentina Vianna, Community Manager at Bix-Tech, explains:
"For agents, queue depth is often more meaningful than CPU. CPU may be low while the agent waits on network calls, but queue depth indicates real backlog."
This manual scaling approach sets Docker Swarm apart from Kubernetes' automated methods, but it also opens the door to creative monitoring integrations.
Monitoring Tool Integration
Docker Swarm integrates well with standard monitoring tools. A typical stack includes Prometheus for metrics collection, Grafana for visualization, cAdvisor for container resource usage, and Node Exporter for host metrics. Prometheus has supported Docker Swarm service discovery (dockerswarm_sd_configs) since version 2.20.0, allowing it to automatically detect nodes, tasks, and services by accessing the Docker socket. With Swarm's service tasks, Prometheus can scrape metrics from all container replicas in a service without manual configuration, using internal DNS (e.g., tasks.<service-name>) to locate running instances.
For centralized logging, critical for debugging distributed AI workloads, teams often rely on the ELK Stack (Elasticsearch, Logstash, Kibana) or Fluentd. Arthur C. Codex, an AI author at Reintech, emphasizes the importance of observability:
"Running containers in production without proper observability is like flying blind."
To ensure comprehensive monitoring, exporters are typically deployed in global mode within the Compose file, ensuring they run on all nodes.
AI-Specific Use Cases
Docker Swarm's simplicity makes it particularly effective for smaller AI projects and resource-constrained environments. It's a practical choice for deploying Retrieval-Augmented Generation (RAG) pipelines. Using Docker Compose, teams can launch an entire stack - including LLM servers, vector databases, and retrievers - with a single command.
For AI agents working with the Model Context Protocol (MCP), Swarm provides essential sandboxing features like filesystem and network isolation. This helps mitigate risks such as prompt injection attacks by restricting container access to host files and commands. Additionally, Docker's isolation capabilities ensure that AI agents running shell commands or modifying repositories remain securely contained, preventing potential breaches.
| Feature | Docker Swarm | Kubernetes |
|---|---|---|
| Auto-scaling | Manual or custom-scripted only | Native (Horizontal Pod Autoscaler) |
| Complexity | Low; intuitive for Docker users | High; steep learning curve |
| Resource Overhead | Lightweight | Requires more system resources |
| AI Use Cases | Small projects, RAG stacks, sandboxed agents | Large-scale, distributed enterprise AI |
When developing custom auto-scalers, it's important to scale up quickly to handle sudden AI processing spikes, but scale down more cautiously to ensure availability. Defining CPU and memory limits in the Swarm Compose file is also critical to prevent a single AI model from consuming all of a node's resources. Docker Swarm's low overhead and ease of use make it a great option for smaller AI setups, while Kubernetes remains better suited for complex, enterprise-level deployments.
Pros and Cons
Let’s break down the practical advantages and challenges of using Kubernetes and Docker Swarm for AI monitoring, building on their technical capabilities.
Kubernetes dominates the market with an impressive 88%–92% share and is used by 96% of enterprises. However, its complexity and higher operational costs can make it less appealing for smaller teams. This widespread adoption has created a rich ecosystem of AI-focused tools, but it requires a substantial investment in both expertise and infrastructure.
When it comes to scalability, Kubernetes supports over 5,000 nodes and 150,000 pods, while Docker Swarm is generally effective up to about 1,000 nodes. For AI workloads that need GPU scheduling, Kubernetes offers native support via the NVIDIA GPU Operator. In contrast, Docker Swarm relies on manual device mapping and custom scheduling. As PropTechUSA AI puts it:
"Kubernetes shines when you need enterprise-grade features like RBAC, network policies, and complex deployment strategies. The learning curve is steep, but the ecosystem maturity pays dividends at scale".
That said, this power comes at a hefty price. Kubernetes deployment costs can range from $50,000 to $300,000 per year due to factors like managed service fees (e.g., AWS EKS costs around $73 per month per cluster), specialized talent, and the resource demands of the control plane, which can consume 5% to 15% of total cluster resources. By comparison, Docker Swarm is more budget-friendly, with annual costs between $20,000 and $50,000, thanks to its lower resource overhead.
Interestingly, as The Decipherist points out:
"The only feature K8s has that Swarm genuinely lacks is autoscaling - and half of K8s users don't even use it".
A 2023 Datadog report revealed that only about 50% of Kubernetes users have implemented the Horizontal Pod Autoscaler. For teams managing fewer than 10 AI models, Docker Swarm’s simplicity often outweighs Kubernetes' advanced features.
These trade-offs have a direct impact on AI monitoring, system reliability, and cost-efficiency. Choosing the right platform depends on balancing operational complexity with scalability requirements.
| Feature | Kubernetes | Docker Swarm |
|---|---|---|
| Node Scalability | High (5,000+ nodes) | Medium (~1,000 nodes) |
| Auto-scaling | Native HPA, VPA, Cluster Autoscaler, KEDA | Manual or custom scripts |
| GPU Support | Native via NVIDIA GPU Operator | Manual device mapping required |
| Monitoring Integration | Deep integration with Prometheus, Grafana, Istio, Kubeflow | Manual third-party setup (cAdvisor, ELK) |
| Self-Healing | Advanced (Liveness, Readiness, Startup probes) | Basic (restart on failure) |
| Annual Cost | $50,000–$300,000 | $20,000–$50,000 |
| Complexity | High (weeks/months to master) | Low (familiar Docker CLI) |
These comparisons highlight the key factors organizations need to consider when deciding between Kubernetes and Docker Swarm for AI workloads.
Conclusion
Kubernetes has firmly established itself as the go-to solution for scalable AI monitoring. With 82% of container users running Kubernetes in production and 66% of organizations leveraging it for AI inference workloads, it provides the monitoring capabilities and scalability needed to support modern AI systems. As Jonathan Bryce, Executive Director of CNCF, aptly put it:
"Kubernetes has solidified its role as the 'operating system' for AI... it isn't just scaling applications; it's becoming the platform for intelligent systems."
That being said, Docker Swarm still holds its ground for smaller-scale or rapid deployments. For teams working on proof-of-concept projects or managing fewer than 10 models, Docker Swarm’s straightforward setup and reduced operational overhead make it a practical alternative.
While Kubernetes offers advanced features, its implementation can be complex and requires specialized expertise. For example, organizations using AI-assisted troubleshooting in Kubernetes environments report a 40–60% reduction in Mean Time to Resolution (MTTR). However, unlocking these benefits often calls for expert guidance.
This is where NAITIVE AI Consulting Agency steps in. We specialize in designing Kubernetes-based monitoring stacks tailored to your AI workload needs, including GPU management and custom metrics setup. Whether you're seeking enterprise-level orchestration with Kubernetes or a simpler Docker Swarm solution, we deliver results that matter - no unnecessary extras.
FAQs
When should I choose Kubernetes over Docker Swarm for AI monitoring?
Kubernetes is the go-to choice for AI monitoring when scalability, fault tolerance, and advanced orchestration are top priorities. It excels at managing large-scale workloads with features like automatic scaling, rolling updates, and self-healing capabilities. On the other hand, Docker Swarm might be a better fit for simpler setups or development environments, especially when ease of use and low overhead are more important.
Which AI metrics should I monitor beyond CPU and memory?
Monitoring more than just CPU and memory is crucial for top-notch AI performance. Pay close attention to metrics like latency, accuracy drift, inference time, and throughput. These indicators ensure your AI models stay reliable and efficient. For hardware-heavy AI tasks, keeping an eye on GPU utilization, disk I/O, and error rates is equally important. Together, these metrics allow you to spot problems early, maintain model reliability, and fine-tune performance - especially in containerized setups like Kubernetes.
How do I autoscale AI agents when CPU usage stays low?
When dealing with I/O-bound tasks like LLM inference, relying solely on CPU utilization for autoscaling can be misleading. These workloads are typically constrained by I/O operations rather than CPU capacity, making traditional CPU-based autoscaling ineffective.
A better approach is to use custom metrics such as:
- Queue depth: Tracks how many requests are waiting to be processed.
- Latency: Monitors the time it takes to handle requests.
- Request count: Measures the volume of incoming requests.
By configuring autoscaling policies around these metrics, you can achieve better performance and cost management. Tools like Kubernetes, paired with event-driven scaling mechanisms, allow for more responsive and efficient scaling - even when CPU usage remains low.