Top 10 Metrics for AI ROI Evaluation
Guide to 10 AI ROI metrics: labor savings, automation, revenue attribution, accuracy, scalability, and sustainability.

Measuring AI ROI is challenging but essential. Many businesses invest heavily in AI without tracking the right metrics, leading to wasted resources and missed opportunities. To evaluate AI's true impact, focus on these 10 metrics:
- Labor Cost Reduction: Tracks payroll savings by automating repetitive tasks.
- Automation Rate: Measures the percentage of tasks AI completes independently.
- Process Improvement Rate: Evaluates workflow efficiency gains across entire processes.
- Revenue Growth Attribution: Links AI efforts to increased revenue.
- Customer Satisfaction (CSAT) and Net Promoter Score (NPS): Tracks AI's impact on customer experience.
- Model Accuracy and Stability: Ensures AI delivers reliable, error-free results.
- Efficiency Gains: Quantifies productivity improvements.
- Energy and Sustainability Metrics: Assesses AI’s energy consumption and related costs.
- Scalability and Infrastructure Cost: Measures cost-effectiveness as AI systems expand.
- Risk Mitigation and Compliance: Tracks how AI reduces regulatory risks and errors.
Key takeaway: Start with cost-focused metrics like labor savings and automation, then expand to revenue and customer experience metrics as AI systems mature. Establish clear baselines and account for "rework" time to ensure accurate ROI calculations.
The REAL Way to Measure AI ROI (Hint: It's Not Usage) | AI Strategy 2026
sbb-itb-f123e37
1. Labor Cost Reduction
Reducing labor costs is a powerful way to improve ROI while also making better use of your team’s potential.
Business Impact
Payroll is often one of the largest expenses for any organization. By using AI to handle repetitive tasks like invoice processing, resume screening, or data entry, companies can lower staffing costs or redirect employees to higher-value tasks. For instance, in February 2026, a financial services firm cut data entry errors from 5% to just 0.3% by implementing AI for document processing. With 10,000 transactions processed monthly and $50 saved per error, the firm reduced costs by $28,200 per month - or $338,400 annually.
AI also creates what’s called "experience compression", where junior staff can produce results similar to those of seasoned professionals. This frees up senior employees to focus on strategic priorities. To quantify these savings, it’s critical to establish clear benchmarks before deploying AI.
Measurability
To track labor cost reductions, you need to set baselines 3–6 months before introducing AI. Record the total labor costs and the time taken for specific tasks. After AI implementation, measure how much manual effort has been reduced, while accounting for any time spent correcting AI errors. As AINative Builders pointed out:
"If AI helps you write a draft in 20 minutes instead of 60 minutes but you spend 25 minutes fixing hallucinations... the actual savings is 15 minutes - not 40."
- AINative Builders
Focus on outcomes that matter. Instead of measuring "documents processed", look at metrics like "cost saved" or "errors prevented". For example, a 2024 study of AI-powered radiology platforms in U.S. hospitals found a 451% ROI over five years, which jumped to 791% when factoring in radiologist time savings. Having these concrete metrics ensures you can evaluate when the investment starts paying off.
Time-to-Value
For straightforward tasks like invoice processing or customer support, AI projects often deliver measurable results within 3–6 months. Operational projects with higher complexity typically aim for a break-even point within 6–9 months. Starting small - say, with a $20,000–$50,000 pilot focused on a specific use case - can demonstrate quick labor savings before scaling up. However, more complex implementations, like predictive maintenance, may require 12 months or more to yield results. These timelines directly impact the overall return on investment.
Relevance to AI ROI
Labor cost reductions provide clear financial benefits that resonate with leadership teams. Nate Suda from Gartner explains:
"This cost reduction metric addresses one of the most significant line items in any organization's budget: payroll."
- Nate Suda, Gartner
A great example comes from JPMorgan Chase, which reported $1.5 billion in cumulative savings by March 2026 thanks to AI-driven fraud prevention and operational efficiencies that reduced the need for manual oversight. This illustrates how cutting labor costs can turn AI investments into measurable financial gains.
2. Automation Rate
When discussing how AI drives efficiency, automation rate is a key metric. It measures the percentage of tasks an AI system completes independently, shedding light on whether AI is truly handling work or merely redistributing it.
Business Impact
A high automation rate allows businesses to scale operations efficiently without increasing headcount. For instance, companies can manage up to 10 times more workload without proportional hiring. This shift redefines roles within teams - employees move from hands-on task execution to supervisory positions. Looking ahead, by 2026, 80% of service agents are expected to transition into new roles as AI takes over their previous tasks.
AI operates at different levels of autonomy. Currently, only 25% of AI systems function entirely on their own. Meanwhile, 40% require active human involvement, and 35% need only passive monitoring. By automating processes, AI can reduce manual data entry by 85–95% and slash customer service costs by 30%.
Measurability
The primary metric to assess automation rate is Task Completion Rate - the proportion of tasks an AI completes without human intervention. For example, single-task AI systems achieve a 54% success rate, meaning 46% of tasks still require human assistance.
However, measuring efficiency isn't just about task completion. You also need to factor in the "rework discount" - the time spent correcting AI errors. Around 40% of the time saved by AI is offset by these corrections. As the LSE Business Review points out:
"Current measurement approaches focus on time savings and cost reductions, while saying very little about the quality or novelty of what is produced."
- LSE Business Review
To get an accurate picture, track your processes for at least four weeks before implementing AI. Then, use A/B testing with control groups over 6–8 weeks to isolate the AI's real impact. This approach clarifies metrics like cost per successful task.
Time-to-Value
Automation rate becomes evident quickly, often within 2–4 weeks of deployment. Most narrow AI systems reach full production within three months. This makes automation rate a reliable early indicator of ROI, providing insights into whether your investment is on track to deliver returns.
Relevance to AI ROI
Automation rate plays a direct role in calculating Cost per Successful Task. However, a high automation rate is meaningless if quality declines. The difference between successful and failed AI projects often lies in measurement discipline, not technology. For example, if the time saved isn't put to productive use, the cost savings disappear.
AI systems tailored to specific business needs can deliver 3–5 times more value. Yet, approximately 60% of AI projects are abandoned because they lack the necessary AI-ready data to achieve effective automation rates. Together with labor cost reductions, automation rate strengthens the financial case for investing in AI.
3. Process Improvement Rate
Process improvement rate looks at how AI impacts the speed, cost-effectiveness, and quality of entire workflows. Unlike the automation rate - which focuses on tasks AI handles on its own - this metric evaluates the full journey, from start to finish. It doesn’t just track how fast things get done but also measures cost savings and quality improvements across interconnected operations.
Business Impact
While automation enhances individual tasks, process improvement rate shows how AI transforms entire workflows. The real benefits emerge when full processes - not just isolated steps - become faster and more efficient.
However, there’s a common pitfall: the "local optimization trap." This happens when you speed up one step, like coding, but don’t address downstream bottlenecks, such as code reviews. As one analysis explains:
"Speeding up one stage without clearing downstream constraints just creates a more impressive traffic jam." - AI Native Builders
For example, mature AI systems can cut routine data analysis time by 25–40%. In customer service, they reduce costs by 30% while keeping error rates below 2%. Sales teams often see a dramatic shift, with sellers doubling their time spent on actual selling - from 25% to over 50% of their workweek.
Measurability
To measure improvement, you need a baseline. Track metrics like cycle time, error rates, and manual hours for at least four weeks before introducing AI. Then, compare these numbers after AI implementation to see what’s changed.
A straightforward way to measure is using the rework discount formula:
Net Savings = Gross Time Saved − Rework Time
This accounts for the time spent fixing or verifying AI outputs. On average, about 40% of the time saved by AI gets offset by rework.
Here’s an example:
| Task | Without AI | With AI (Gross) | Rework Time | Net Savings | Actual Gain |
|---|---|---|---|---|---|
| Feature Spec Draft | 90 min | 25 min | 20 min | 45 min | 50% |
| Unit Test Scaffolding | 45 min | 10 min | 15 min | 20 min | 44% |
| Customer Email | 15 min | 3 min | 8 min | 4 min | 27% |
| Data Analysis Script | 60 min | 15 min | 22 min | 23 min | 38% |
Keep an eye on your rework ratio - the hours spent fixing AI output divided by the hours saved. If this ratio exceeds 40%, the tool might be creating more work than it saves.
To isolate AI’s impact, use A/B testing. Split your team into two groups: one uses AI, and the other doesn’t. Compare their metrics over 6–8 weeks. This approach helps determine whether improvements are due to AI or other factors like process tweaks or new management.
Time-to-Value
Process improvements don’t happen overnight. Leading indicators, such as task completion rates and review times, often show results within 2–4 weeks. But lagging indicators - like end-to-end cycle time, defect rates, and overall feature delivery - can take 8–12 weeks to surface. While narrow, single-task AI tools can be operational in about three months, broader financial gains from redesigned workflows typically take 18–36 months to materialize.
Relevance to AI ROI
Process improvement rate ties directly to financial outcomes. High-ROI use cases include customer service automation (200–400% ROI), invoice processing (300–500% ROI), and sales lead scoring (150–300% ROI). However, these returns depend on evaluating the entire workflow, not just isolated tasks.
Traditional ROI models often fall short for AI because its impact spans multiple departments. As one expert explains:
"The gap between successful and struggling AI implementations isn't primarily technological - it's measurement discipline." - Promethium.ai
Focus on team-level performance rather than individual productivity. Individual metrics can create unhealthy incentives and overlook bottlenecks downstream. Instead, track whether your team delivers higher-quality work faster. Metrics like first-pass quality - the percentage of AI-assisted outputs accepted without major revisions - are particularly useful.
Finally, AI systems tailored to your specific business needs often deliver 3–5 times more value than off-the-shelf solutions. By monitoring process improvement rates alongside automation metrics, you get a clearer view of AI’s overall financial impact. This metric shows how well AI integrates into your workflows, not just how fast it completes tasks.
4. Revenue Growth Attribution
While earlier metrics focus on cutting costs and streamlining operations, revenue growth attribution zeroes in on AI's influence on top-line financial performance. Essentially, it evaluates whether AI contributes to revenue growth beyond just saving time. However, 80% of enterprises fail to demonstrate revenue impact from their AI investments. The issue isn’t that AI doesn’t deliver - it’s that many companies are measuring the wrong outcomes.
Business Impact
The key difference between organizations that thrive with AI and those that struggle lies in how they measure success. Companies that extract meaningful value from AI experience 1.7x higher revenue growth compared to those that don’t. Despite the fact that 74% of organizations aim to achieve AI-driven revenue growth, only 20% actually succeed.
Specific examples highlight AI’s potential for driving revenue:
- AI-powered lead scoring improves conversion rates by 15–30%.
- Pricing optimization increases average deal sizes by 2–8%.
- Personalization tools boost revenue per visitor by 10–25%.
JPMorgan Chase offers a compelling case study: by 2026, the company reported $1.5 billion in combined savings and revenue from AI applications in fraud prevention, personalization, and trading. Similarly, Sutton Tools automated 77% of price inquiries, freeing up 24 hours of agent time in a single month. BuyaCar saw a 33% reduction in call abandonment rates with conversational AI, directly recovering revenue lost to missed customer calls.
Next up: how to pinpoint and quantify these gains effectively.
Measurability
Isolating AI’s direct impact from other factors like market changes or process improvements requires careful evaluation. The most reliable method? A/B testing. Divide teams or customer groups into treatment groups (using AI) and control groups (using traditional methods), then track their performance over at least 12 weeks.
If permanent control groups aren’t feasible, consider alternating sprint designs. Alternate between AI-enabled and non-AI-enabled sprints, then compare delivery metrics across these periods. Another approach is regression discontinuity: if AI was implemented on a specific date, compare revenue trends just before and after, adjusting for other variables.
To ensure time savings translate into revenue, measure metrics like revenue per AI-enabled employee. As one expert puts it:
"If your AI agent saves an employee 2 hours per day, but that employee spends those 2 hours browsing LinkedIn, you saved nothing." - iEnable Team
Don’t forget to account for rework discount adjustments, as previously discussed.
Time-to-Value
Unlike efficiency gains, revenue impact takes longer to materialize. While task-level improvements might appear within 6–18 months, meaningful revenue growth typically requires 18–36 months to stabilize. This is because achieving revenue gains often involves redesigning workflows around AI, rather than simply automating existing tasks.
To establish a clear starting point, collect at least 3–6 months of historical data before deploying AI. This helps account for market fluctuations and seasonal trends. Without this baseline, proving the impact of AI becomes nearly impossible.
With these timelines in mind, the ultimate goal is to link revenue increases back to overall ROI.
Relevance to AI ROI
Revenue growth attribution is the ultimate measure of AI’s return on investment. It answers the critical question: do productivity gains translate into tangible business value? Companies are shifting their focus from "hours saved" (an input metric) to "revenue per employee" and "decision quality" (outcome metrics) to demonstrate AI’s value to financial stakeholders.
To ensure unbiased reporting, separate the team deploying AI from the team measuring its ROI. Assign measurement responsibilities to Finance or Strategy departments to avoid conflicts of interest. As one analysis explains:
"The gap between successful and struggling AI implementations isn't primarily technological - it's measurement discipline." - Promethium.ai
AI systems tailored to an organization’s specific needs - such as pricing rules, compliance standards, and customer segmentation - yield 3–5x greater value than generic models. By embedding AI into decision-making processes, companies can achieve direct revenue gains, not just faster task completion.
When combined with labor savings, automation, and operational improvements, revenue growth attribution rounds out the framework for evaluating AI’s ROI.
5. Customer Satisfaction Score (CSAT) and Net Promoter Score (NPS)
Revenue attribution might highlight AI's impact on growth, but CSAT and NPS reveal its influence on customer experience. Without measuring satisfaction, up to 72% of AI initiatives risk failing to deliver value. Tracking these metrics ensures AI doesn’t just cut costs - it supports long-term business growth.
Business Impact
Strong CSAT and NPS scores often lead to better financial performance. Improvements driven by AI in these areas can boost customer retention, increase lifetime value, and improve upsell opportunities. For instance, in May 2025, a leading e-commerce retailer saw an 18-point jump in CSAT, resulting in a 285% ROI over three years with a payback period of just seven months. Similarly, a B2B SaaS company leveraged conversational AI to improve customer retention by 12% and boost website conversion rates by 35%, achieving a 320% ROI over two years.
A key insight from Promethium.ai highlights the importance of satisfaction alongside automation:
"A customer service operation seeing 85% deflection with 70% CSAT tells a different financial story than 85% deflection with 90% CSAT." - Promethium.ai
High automation without corresponding satisfaction can signal value loss rather than gain. In fact, 74% of organizations recognize customer service and experience as critical areas where AI delivers strong returns. To achieve these outcomes, precise measurement is essential.
Measurability
CSAT is calculated using the formula: (Satisfied Customers ÷ Total Responses) × 100%. NPS, on the other hand, is determined by subtracting the percentage of detractors from the percentage of promoters (% Promoters - % Detractors). For a clear picture of AI’s impact, track these metrics separately for AI-only, human-only, and hybrid interactions.
The goal? AI-driven CSAT should stay within 5–10% of human-agent scores, while successful implementations often aim for a 5–15 point increase in NPS compared to pre-AI levels. To separate AI’s effects from broader market trends, establish baseline satisfaction metrics before deployment. A controlled approach - routing some inquiries to AI (treatment) and others to human agents (control) - helps isolate AI’s specific contribution. Be sure to apply standard rework adjustments as previously outlined.
Time-to-Value
Unlike operational metrics, which can show improvement quickly, CSAT and NPS take longer to reflect meaningful changes. While response times might improve within weeks, satisfaction metrics typically stabilize after 8–12 weeks, as they represent cumulative customer experiences over time.
To get reliable insights into AI’s impact on customer loyalty and retention, collect data for at least three months after deployment.
Relevance to AI ROI
These metrics ensure that technical achievements - like high model accuracy or deflection rates - translate into real-world value for customers. They help quantify the "soft ROI" of AI, such as stronger brand loyalty and better customer relationships, which traditional financial metrics often overlook. Together with cost savings, automation, and revenue metrics, CSAT and NPS provide a complete view of AI’s return on investment.
6. Model Accuracy and Performance Stability
Technical accuracy only matters if it translates into real business outcomes. For instance, a 95% accurate AI system might fall short if your team already achieves 99%, but it could deliver significant gains if your baseline is closer to 92%. The real measure of success lies in comparing performance against actual operational benchmarks, not just theoretical standards.
Business Impact
Accuracy issues can result in a "rework tax", where some of the time saved by AI is lost to reviewing and correcting errors. Around 40% of AI-driven time savings are spent on rework and error fixes. The financial stakes grow with the value of the task: while 95% accuracy might suffice for processing $100 invoices, it becomes a liability when handling $1 million contracts.
One example is a legal collections firm that adopted a multi-agent system with anti-hallucination features and verification loops. Within just 30 days, they reduced document processing errors by 75%, improved payment arrangement rates by 40%, and cut human oversight from 8 hours a day to under 2 hours.
Consistency is just as important as initial accuracy. AI models can degrade over time as real-world conditions drift from the training data. Without ongoing monitoring, a well-performing model can quietly turn into a problem. For example, JPMorgan Chase implemented robust tracking systems for its AI agents, resulting in $1.5 billion in cumulative savings across fraud prevention, personalization, and trading applications. This demonstrates how technical performance can directly tie to financial results, reinforcing earlier ROI metrics like labor cost savings and improved processes.
Measurability
To assess AI performance, track the first-pass quality rate - the percentage of outputs accepted without human intervention. Mature AI systems often achieve correctness rates between 88% and 95%, with 5% to 12% of outputs requiring manual corrections. Before deployment, establish your team’s baseline accuracy over three to six months to measure any improvements.
Other helpful metrics include override rates, escalation rates, and staleness rates, which indicate where human corrections are needed. These insights help pinpoint areas where AI performance could improve.
The ECOSIRE Research and Development Team put it succinctly:
"Model accuracy is a technical metric, not a business metric. A 95% accurate model that saves $500,000 is better than a 99% accurate model that saves $50,000."
Time-to-Value
Accuracy issues often become noticeable within the first few weeks of deployment, unlike customer satisfaction metrics, which may take months to stabilize. However, achieving consistent, reliable performance typically takes longer - plan for three to six months to reach stability, with peak performance often arriving after about 12 months. Monthly performance reviews can help catch and address any issues before they impact ROI.
Relevance to AI ROI
Accuracy is a critical factor in determining whether AI adds value or becomes a hidden cost. Many AI initiatives fail to meet ROI expectations - 70% fall short, largely because companies focus on technical benchmarks instead of operational impact. With inference costs dropping significantly (by a factor of 280 since late 2022), high-accuracy systems with multi-step verification loops are now more affordable.
When calculating ROI, don’t forget to account for the "rework discount." Subtract the time spent on corrections from the gross time saved to get a clearer picture of the model’s true value.
7. Efficiency Gains
Business Impact
Efficiency gains are one of the clearest benefits of AI investments, but understanding their true value requires more than just tracking time saved. The real question is: How much productive capacity has actually increased?
For example, AI-powered data entry automation can cut task times by 85-95%. Developers using AI coding tools save an average of 3 hours and 45 minutes per week, which translates into a 5-15% boost in productivity. In customer service, AI implementations often reduce service costs by 30%, while marketing teams report spending 50-70% less time on content creation.
However, the biggest impact comes when these time savings are reinvested into higher-value, strategic work. This concept, sometimes called "Return on Employee", often outweighs the raw time saved. As with other metrics, these efficiency gains directly influence operational margins and the overall return on investment (ROI).
Measurability
To track efficiency gains accurately, use the Net Savings formula: Gross Time Saved minus Rework Time. Establish a baseline by collecting 3-6 months of pre-AI data, including metrics on volume, time, cost, and quality. Without this baseline, any claims of improvement are just guesses.
It's also important to measure results at the team level rather than the individual level. Focusing on individuals can lead to unhealthy incentives, where people prioritize looking busy over achieving meaningful results. Evaluate end-to-end cycle times instead of isolated tasks, as speeding up one part of the process is meaningless if it creates delays elsewhere, like during code reviews or quality assurance.
Another key metric is the rework ratio, which is calculated by dividing the hours spent fixing AI output by the hours saved through automation. This helps determine whether your AI system is consistently performing well or starting to degrade. For cost benchmarks, optimized customer service tasks can range from $0.02–$0.05 per task, while more complex data analysis tasks cost between $0.05–$0.15. These figures help paint a clearer picture of AI's financial impact.
Time-to-Value
Efficiency gains from AI often appear within 2-4 weeks of deployment, as seen in metrics like AI-assisted task completion rates and shorter review cycles. However, achieving stable and reliable efficiency takes more time. Conduct an initial assessment at 90 days to observe adoption trends, a formal ROI evaluation at 6 months, and a comprehensive review at 12 months for more complex systems.
For high-volume automation tasks like invoice processing, payback can occur within 1-3 months. Customer service chatbots typically reach this point in 2-4 months, while narrow AI agents average a production timeline of about three months.
Relevance to AI ROI
Efficiency gains are a key piece of the overall AI ROI puzzle, alongside cost savings and process improvements. These gains act as foundational metrics, proving that AI can perform tasks faster or more accurately than humans. By reducing labor costs and increasing team productivity, efficiency improvements directly impact operational margins and EBITDA.
However, 80% of enterprises struggle to show revenue impact from AI because they focus on "hours saved" rather than tying those savings to business outcomes. When calculating ROI, it's essential to account for the full cost of AI tools. While licenses may run $200-$600 per year, the actual annual cost - including training, prompt engineering, and oversight - can range from $2,700 to $9,600, a 3-16x multiplier. Applying a rework discount ensures that time saved translates into measurable business value.
8. Energy Consumption and Sustainability Metrics
Business Impact
AI's growing energy demands are becoming a key factor in operational costs and regulatory compliance. By 2026, the global AI market is expected to use 4.6% of the world's electricity, up from around 2% in 2023. Training a single large language model can result in emissions of 300–500 metric tons of CO₂.
The financial implications are clear. Microsoft's 2025 Sustainability Report highlighted a 31% year-over-year increase in Scope 2 emissions, primarily due to AI infrastructure expansion. To address this, the company introduced an internal carbon tax of $100 per metric ton to encourage efficiency. Companies that measure AI's environmental impact often find ways to cut compute costs by 20% to 40%. Meanwhile, regulatory requirements are tightening. Rules like the EU Corporate Sustainability Reporting Directive (CSRD), SEC climate regulations, and California SB 253 now mandate AI carbon footprint reporting. Failure to comply can lead to significant audit risks, underscoring the importance of accurate sustainability tracking.
Measurability
Metrics like energy per 1,000 inferences (kWh/1k) help make AI's energy usage more transparent to finance teams. Pairing this with carbon attribution per 1,000 inferences (gCO₂e/1k) converts energy consumption into emissions data based on regional grid intensity.
Another key metric, Power Usage Effectiveness (PUE), compares total data center power to IT equipment power. The industry average PUE improved to 1.42 by 2025, while top hyperscale operators achieve between 1.08 and 1.12. Water Usage Effectiveness (WUE) measures liters of water used per kWh of IT energy, a critical metric since AI GPU clusters generate two to three times the heat of standard server racks. Yet, fewer than 18% of organizations track environmental metrics beyond basic electricity costs, and energy measurements for hosted APIs often have a ±30% uncertainty margin.
Time-to-Value
Speed matters when implementing sustainability improvements. Some changes deliver immediate benefits. For example, carbon-aware scheduling - running non-urgent training jobs during times or in regions with high renewable energy availability - can cut emissions by 20% to 40% without requiring new infrastructure. In June 2025, researchers found that the "Prefill" phase of a Llama2-7b model on an NVIDIA A800 GPU consumed 90W more peak power than the "Decode" phase, revealing opportunities for phase-specific optimizations.
Larger architectural changes offer even greater long-term savings. Transitioning from GPT-4 class models to smaller, optimized models (7B–13B parameters) using techniques like quantization, pruning, and knowledge distillation can slash inference compute costs by 80% to 95%. By early 2026, 35% of new AI-focused data centers adopted liquid cooling, which not only improved PUE by 15% to 25% but also reduced water usage by up to 90% compared to traditional evaporative cooling in dry regions.
Relevance to AI ROI
Incorporating environmental costs into ROI calculations can highlight hidden expenses and unlock savings.
"The question 'does this workflow pay for itself' cannot be answered without a unit-cost metric. Sustainability and FinOps converge on the same measurement." – COMPEL Framework
Energy and carbon metrics aren't just environmental considerations - they are essential for accurate ROI analysis. Ignoring energy, retrieval fees, and orchestration overhead results in incomplete cost assessments. For example, agentic workflows that involve thousands of token interactions across multiple tools can create energy costs that are often invisible to procurement teams. By linking these costs to specific budget lines, sustainability metrics enable finance teams to demand the detailed unit-cost data needed for true ROI evaluations.
9. Scalability and Infrastructure Cost
Business Impact
Scalability plays a key role in determining whether AI investments can deliver increasing returns as your operations expand. The big question is: can your system handle more work without driving costs through the roof?
Right now, 30% to 50% of AI infrastructure spending is wasted on idle GPU resources and overly complex setups. Many companies over-prepare for peak loads that rarely happen, leaving expensive hardware sitting unused. On top of that, 40% of agentic AI projects are expected to be canceled by 2027 due to skyrocketing costs and unclear business value. The companies that thrive will be the ones that figure out how to manage infrastructure efficiently.
The financial stakes are high. Annual model maintenance costs can eat up 15% to 25% of the initial deployment cost. Add in review processes, training, and infrastructure, and the total cost can balloon to 3 to 16 times the initial license fees. A system that seems affordable in a pilot phase can become unsustainable when rolled out across the entire organization.
Measurability
To truly understand scalability, you need to track how efficiently your system handles increased demand. Start by measuring cost per successful task, which includes compute costs, API fees, human oversight, and correction time. This gives you a clear view of resource efficiency as workloads grow.
Another critical factor is infrastructure density. Well-executed AI systems can increase output by 40% without adding more support staff. This happens when automation takes over tasks that previously required human effort. Keep an eye on how much additional output you’re generating for every dollar spent on infrastructure.
The choice of models also has a massive impact. For example, switching from flagship models like GPT-4 to smaller, task-specific models can slash infrastructure costs by 80%. While this might slightly reduce completion rates - say, from 0.62 to 0.56 for routine classification tasks - the savings make it a smart move for high-volume operations.
Time-to-Value
Infrastructure costs tend to follow a predictable timeline. During the initial 3-to-4 month pilot phase, budget 10% to 15% of total spend to test your use case and establish key metrics. Then, allocate 40% to 50% for the 6-to-9 month scaling phase, where systems are productionized and teams refine their capabilities.
Most implementations start with a negative ROI in the first few months. This is because teams are still learning the ropes and integrating the system. However, ROI typically turns positive between months 7 and 12 as costs stabilize and benefits grow. A 90-day review can help you assess early adoption rates and infrastructure performance before committing to full-scale rollout.
Relevance to AI ROI
Scalability metrics are essential to ensuring AI investments drive growth rather than becoming financial burdens. The transition from basic "talking" bots to more advanced "doing" bots - AI systems with read/write access to platforms like CRM or ERP - unlocks entirely new value chains at scale.
"Agentic AI ROI is about autonomous value chains. It's not just about doing things cheaper; it's about doing things that were previously impossible at scale."
- AGIX Technologies
To maximize ROI, infrastructure costs need to be spread across the entire organization. As AI adoption grows - from finance to operations to customer service - fixed costs are distributed across more tasks, improving your cost-per-task metric. This kind of cross-functional scaling is what separates truly successful AI deployments from costly experiments. Without proper scalability, hidden infrastructure and maintenance costs can quietly erode your ROI over time.
10. Risk Mitigation and Compliance Adherence
Business Impact
A single misstep in compliance can wipe out an entire year's worth of AI-driven progress. For industries like finance and healthcare, where regulations are tight, having strong risk mitigation measures in place acts as a safeguard for your investment, protecting it from potentially devastating losses. For example, major financial institutions have shown that effective AI risk management can lead to savings in the billions. In the European Union, the European Parliament has projected multibillion-euro compliance costs for adhering to the EU AI Act. But the risks go beyond just fines - poorly governed AI can lead to fraud, reputational harm, and wasted productivity as teams scramble to fix errors. Alarmingly, 22% of organizations are currently using AI without any formal audit process, which creates a trust gap and undermines their overall investment. These risks are not just theoretical - they can be tracked and measured through specific indicators.
Measurability
To put these risks into numbers, focus on measurable indicators like a reduction in regulatory fines and faster fraud detection times. Another key metric is the defect escape rate, which tracks how many AI-related errors or compliance issues make it into production. Pair this with the frequency of policy violations to assess how often your AI outputs fail to meet compliance standards. For a clearer picture of ROI, subtract the time experts spend double-checking AI-generated compliance reports to calculate net productivity gains. Establishing clear baselines and metrics upfront is crucial for understanding deployment timelines and measuring success.
Time-to-Value
Implementing compliance and governance frameworks can extend your development timeline by about 3 to 6 months before deployment. In regulated industries, it’s a good idea to conduct a 2- to 4-week baseline study before rolling out AI. This study should track compliance incidents, manual audit hours, and error rates to give you a solid foundation for evaluating ROI later on.
Relevance to AI ROI
Risk mitigation plays a critical role in calculating risk-adjusted ROI - a model that incorporates compliance exposure and potential liabilities under regulations like the EU AI Act or HIPAA. By integrating risk mitigation into your ROI calculations, you ensure that compliance costs and liabilities are accounted for alongside efficiency gains. To avoid overly optimistic projections, make sure to include all costs related to compliance and governance, such as audits, monitoring, and policy reviews, in your Total Cost of Ownership (TCO). Additionally, implement quality gates with metrics that track speed and compliance, ensuring that faster outputs don’t come at the expense of safety. The ultimate goal isn’t just quicker results - it’s achieving them responsibly and securely.
Comparison Table
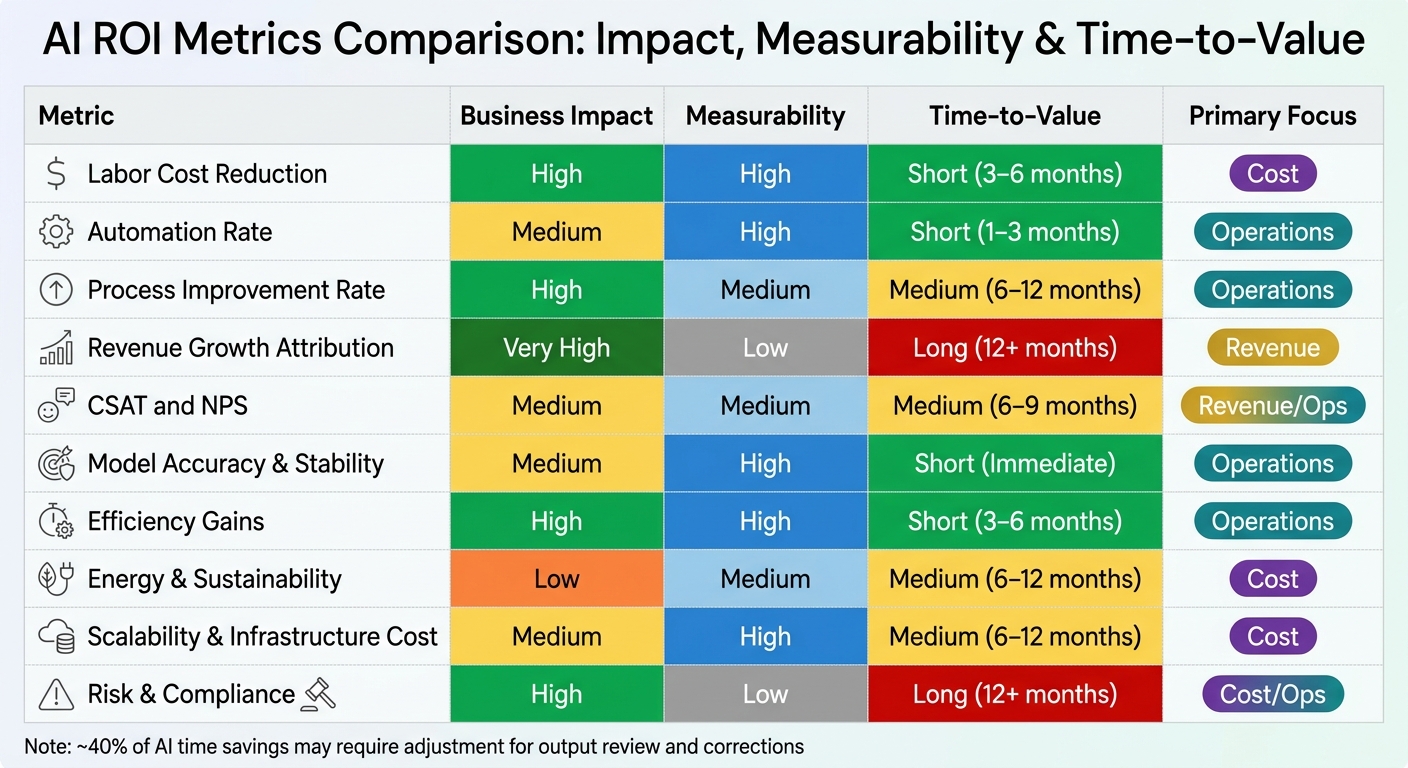
10 Key Metrics for AI ROI Evaluation: Impact, Measurability and Time-to-Value Comparison
Evaluating AI ROI involves using metrics that collectively reflect cost savings, revenue impacts, and operational improvements. When focusing on costs, metrics should demonstrate immediate savings to the profit and loss statement. Revenue evaluations, on the other hand, need to show AI-driven growth, though pinpointing its exact contribution can be tricky. Operational metrics focus on tracking systemic improvements, which often act as early indicators of long-term financial benefits.
The table below outlines 10 key metrics, assessed across four dimensions: business impact, measurability, time-to-value, and primary evaluation focus. Metrics like Labor Cost Reduction and Efficiency Gains stand out for their high impact and quick returns. Conversely, Revenue Growth Attribution offers the greatest potential impact but faces challenges with measurability and requires longer timelines - often over 12 months with control groups to isolate AI's specific role.
| Metric | Business Impact | Measurability | Time-to-Value | Primary Focus |
|---|---|---|---|---|
| 1. Labor Cost Reduction | High | High | Short (3–6 months) | Cost |
| 2. Automation Rate | Medium | High | Short (1–3 months) | Operations |
| 3. Process Improvement Rate | High | Medium | Medium (6–12 months) | Operations |
| 4. Revenue Growth Attribution | Very High | Low | Long (12+ months) | Revenue |
| 5. CSAT and NPS | Medium | Medium | Medium (6–9 months) | Revenue/Ops |
| 6. Model Accuracy | Medium | High | Short (Immediate) | Operations |
| 7. Efficiency Gains | High | High | Short (3–6 months) | Operations |
| 8. Energy & Sustainability | Low | Medium | Medium (6–12 months) | Cost |
| 9. Scalability & Infra Cost | Medium | High | Medium (6–12 months) | Cost |
| 10. Risk & Compliance | High | Low | Long (12+ months) | Cost/Ops |
Note: "Model Accuracy" here refers to the broader metric of "Model Accuracy and Performance Stability." Keep in mind that roughly 40% of AI time savings may need to be subtracted to account for reviews of low-quality outputs.
For those seeking quick results, Labor Cost Reduction and Automation Rate are excellent starting points. These metrics are easy to measure and can deliver outcomes within 1–6 months. When presenting a case to executives, it’s best to combine operational and cost-focused metrics, while reserving revenue-focused ones for more advanced AI implementations. This approach highlights the importance of selecting the right combination of metrics to effectively demonstrate AI's return on investment.
Conclusion
Measuring the return on investment (ROI) for AI requires a careful balance between financial and operational metrics. Operational metrics - such as time saved and automation rates - can signal early progress, but they don't inherently prove business value. As the iEnable Team aptly points out:
"If your AI agent saves an employee 2 hours per day, but that employee spends those 2 hours browsing LinkedIn, you saved nothing".
Financial metrics, like revenue growth and cost reduction, ultimately showcase business impact. However, without operational data to back them up, it can be hard to identify what’s driving those results. A combined approach is essential for a meaningful evaluation.
The data reveals a significant gap in measuring AI's impact. While 72% of organizations have adopted AI in at least one function, only 26% can quantify its financial benefits. Moreover, about 80% of enterprises struggle to demonstrate a direct revenue impact from their AI investments. This disconnect often stems from a lack of tracking the right metrics, not from the technology itself.
To close this gap, establishing clear baselines before deploying AI is critical. Collect at least 90 days of baseline data on key metrics like task time, cost per transaction, error rates, and customer satisfaction. As AI Assembly Lines emphasizes:
"No baseline means no ROI calculation".
This reinforces the importance of aligning metrics with business goals.
Every ROI metric should answer whether to scale, maintain, or stop the AI initiative. Be wary of vanity metrics like adoption rates - they might look good on paper but mean little if they don’t improve financial outcomes. Even widespread adoption won’t deliver ROI if it fails to drive tangible results.
Don’t overlook hidden costs that standard financial metrics might miss. For instance, around 40% of AI-saved time could be offset by time spent on corrections. Using 12-week control group testing can help isolate AI's true impact. Organizations that adopt disciplined measurement practices report an average return of $3.70 for every $1 invested in AI. In the end, success lies not in the technology itself but in measuring its impact rigorously to guide strategic decisions.
FAQs
How do I set an ROI baseline before AI?
Before diving into AI implementation, it's crucial to establish a clear baseline for ROI. Start by pinpointing your key business goals - whether that's cutting costs, boosting revenue, or improving productivity. Once you have those goals defined, choose metrics that directly align with them.
Your measurement framework should include both quantitative metrics (like financial gains or cost reductions) and qualitative outcomes (such as improved customer satisfaction). The key is to focus on results that can be clearly measured - like fewer errors or increased efficiency - rather than relying on activity-based indicators, such as how many people adopt the AI. This approach ensures you have a solid and meaningful starting point for evaluating success.
How do I account for AI “rework” time in ROI?
To get a clearer picture of ROI when using AI, it's crucial to account for what's often referred to as the "rework tax." This means tracking the time and resources spent refining or correcting AI-generated outputs. By including these extra efforts in your total operational costs, you can avoid inflating AI's perceived value and arrive at a more accurate ROI calculation.
Which AI ROI metrics should I track first?
Start by honing in on metrics that matter most: cost savings, time reductions, and revenue impact. These are universally regarded as critical measures of AI's return on investment (ROI) and serve as a solid foundation for assessing the effectiveness of your AI initiatives.