How to Build Scalable Real-Time Data Systems
Set latency SLOs, pick Lambda or Kappa, partition by entity, manage state, and monitor lag to build scalable real‑time pipelines.

If I had to boil this down to one point, it’s this: I don’t start with tools. I start with targets. For most teams, that means setting latency goals like under 250 ms, 250 ms to 5 seconds, or 5 to 60 seconds, then sizing for traffic such as 15,000 events per second with spikes up to 75,000, while keeping uptime around 99.9% to 99.99%.
Here’s the short version:
- I define success with p95 and p99 latency, not averages
- I match the design to the workload, like fraud scoring, IoT streams, dashboards, or CDC
- I pick Lambda if batch and stream both matter, or Kappa if one stream path is enough
- I scale with partitions, state control, idempotency, and replay
- I watch lag, errors, backpressure, and cost per 1,000 events
- I scale consumers from lag and backlog, not just CPU
In other words: a scalable real-time system is just a pipeline that can ingest, process, store, serve, and recover under load without letting latency drift, costs run wild, or failures pile up.
What follows is my condensed take on the article, with the main build choices, tradeoffs, and rules kept simple.
Building the Next Generation of Real Time Data Pipelines: Data Mesh and Streaming SQL at Netflix

sbb-itb-f123e37
Choose the Right Architecture and Core Stack
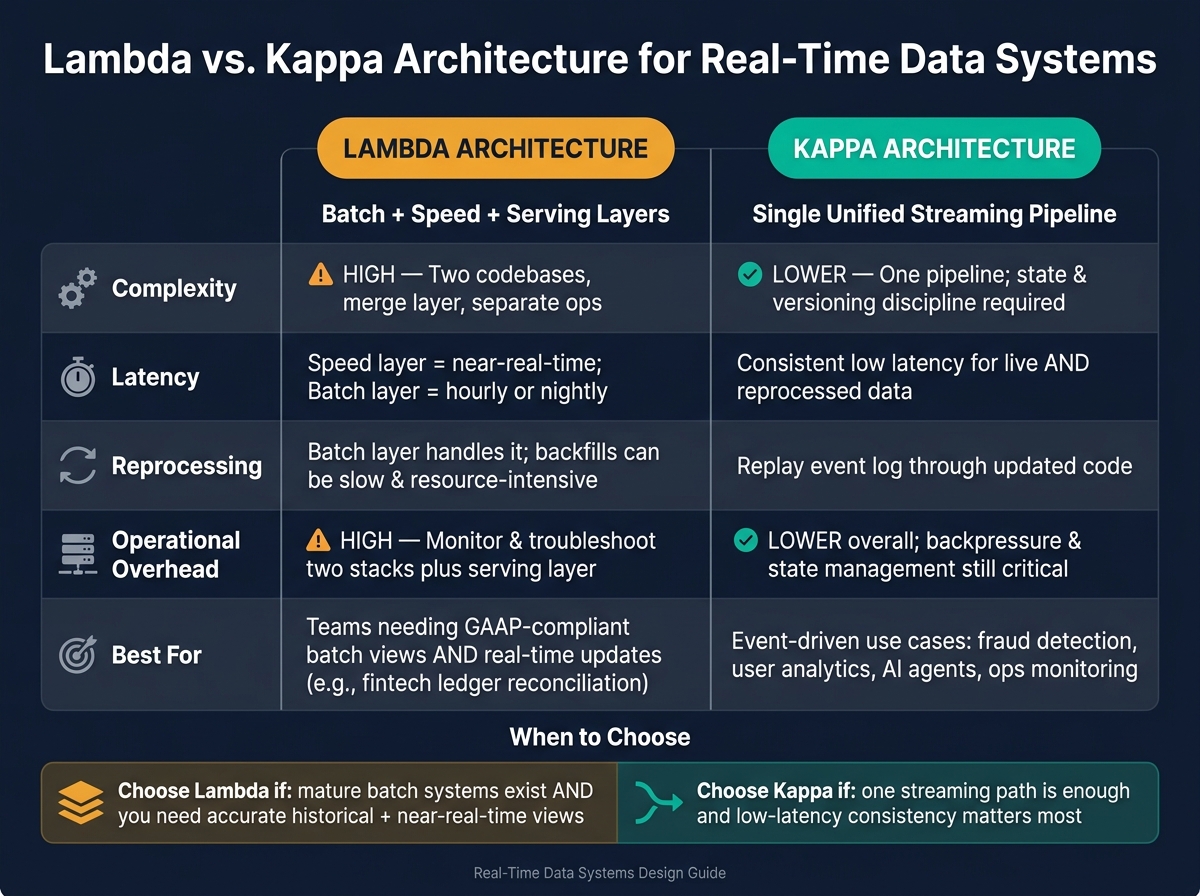
Lambda vs. Kappa Architecture: Real-Time Data System Comparison
Once you’ve set latency and throughput targets, the next call is the architecture pattern. That choice affects almost everything after it: how data gets split, how failures are handled, and how much day-to-day ops work your team has to carry over time.
Lambda vs. Kappa Architecture: When to Use Each
Lambda architecture, introduced by Nathan Marz, uses a batch layer for accurate historical computation, a speed layer for low-latency views, and a serving layer that combines both. It makes sense for teams that already have mature batch systems and need accurate historical views and near-real-time views. A good example is a U.S. fintech that needs GAAP-compliant nightly ledger reconciliation alongside real-time balance updates.
Kappa architecture removes the batch layer and sends all data through one streaming pipeline. If you need to reprocess data, you replay the event log through updated code. This setup works well for event-driven use cases like fraud detection, user behavior analytics, ops monitoring, AI-driven personalization, and autonomous agents, where a steady live stream matters more than a reconciled batch view.
| Dimension | Lambda | Kappa |
|---|---|---|
| Complexity | High - two codebases, a merge layer, and separate ops | Lower - one pipeline, but strong state and versioning practices are still required |
| Latency | Speed layer is near-real-time; batch layer is hourly or nightly | Consistent low latency for both live and reprocessed data |
| Reprocessing | Batch layer handles it; backfills can be slow and resource-intensive | Replay the event log through updated code |
| Operational overhead | High - teams monitor and troubleshoot two stacks plus serving | Lower overall, but backpressure and state management still need discipline |
Pick here carefully. This is the fork in the road that shapes how you partition data, manage state, and deliver results to downstream systems.
A Reference Stack for Ingest, Process, and Serve
For ingestion, start with a durable event log that fits your deployment model and ordering needs.
| Tool | Best Fit |
|---|---|
| Apache Kafka | On-premises or multi-cloud; strong ordering guarantees |
| Amazon Kinesis | Fully managed ingestion on AWS |
| Google Pub/Sub | Fully managed ingestion on GCP |
For stream processing, the right framework depends on your SLAs and what your team can run well in practice.
| Framework | Scalability | Latency | State Handling | Deployment Model |
|---|---|---|---|---|
| Apache Flink | Horizontal cluster scaling | Millisecond latency | Robust keyed state, checkpoints, savepoints, exactly-once | Dedicated cluster (Kubernetes, YARN) |
| Spark Structured Streaming | Horizontal cluster scaling | 100–500 ms micro-batch | mapGroupsWithState; more batch-oriented conceptually | Spark cluster (shared with ETL/ML) |
| Apache Beam | Depends on runner | Runner-dependent | Abstracted state and timers | Multi-cloud via chosen runner |
| Kafka Streams | Scales with app instances | Low with tuning | Embedded state stores such as RocksDB | Embedded in microservices (for example, Spring Boot) |
For serving, choose the data store based on how people or systems will query it.
| Store | Best Fit |
|---|---|
| Cassandra, DynamoDB, Bigtable | High-write key-value workloads |
| ClickHouse, Apache Pinot | Real-time OLAP and sub-second analytical queries |
| Redis | Caches and fast lookups such as session state for chatbots |
When to Work with NAITIVE AI Consulting Agency
For AI automation workloads, architecture choices also affect agent state, voice latency, and recovery after failure. That matters a lot with autonomous agents, phone and voice agents, and business process automation, where even small delays can pile up fast.
NAITIVE AI Consulting Agency helps design and manage real-time systems for AI automation, autonomous agents, phone/voice agents, and business process automation.
Design a Horizontally Scalable Real-Time Pipeline
With the architecture set, the next job is making ingestion, processing, and recovery grow together. That’s where pipeline design stops being theory and starts showing up in throughput, latency, and failover behavior. For organizations struggling with these complexities, NAITIVE AI consulting provides specialized architectural guidance.
Ingestion and Partitioning for Parallel Throughput
Partitioning is what gives you parallel throughput. More partitions mean more consumers can work at the same time. For example, at about 200 MB/s per partition, hitting 10 GB/s calls for roughly 50 partitions.
A common place to start is 2–4 partitions per consumer core, and one production setup begins at 20 partitions and moves to 40 after event rates pass 50,000 events per second.
But partition count isn’t the main thing. The partition key matters more.
Use a high-cardinality key like customer_id, account_id, or device_id. That keeps events for the same entity in one partition, which preserves ordering for that entity. If the key is skewed, you get hot partitions: one shard gets slammed while others barely do any work.
When skew can’t be avoided, add a sharding suffix such as customer_id + random_shard. That spreads traffic out while still keeping ordering acceptable at the shard level.
You also want to size partitions for where the system is going, not just where it is now. Plan for 12–18 months of growth. Repartitioning a live topic can be painful, so it’s better to leave room early. On the producer side, tune batching with batch.size and linger.ms. On the consumer side, control fetch behavior and in-flight work with max.poll.interval.ms and in-flight limits.
Once partitioning is balanced, the next pressure point is state. If state grows without limits, scale starts to hit memory walls.
Stateful Stream Processing and Low-Latency Storage
Tools like Apache Flink and Kafka Streams keep per-key state across events. That state powers windows, joins, and aggregations.
Different window types fit different jobs:
- Tumbling windows for fixed time buckets
- Sliding windows for overlapping views
- Session windows for bursty user activity
For stream-stream joins, set retention and watermarks so state stays bounded and late events are still handled correctly.
Effectively-once processing comes from putting a few parts together: idempotent producers, transactional writes, and checkpoints that save operator state and offsets at the same time. Flink’s distributed snapshot algorithm handles this across all partitions and operators in one coordinated pass.
Checkpoint timing is a tradeoff. Shorter intervals cut recovery time, but they add runtime overhead. Longer intervals lower that overhead, but they increase the amount of data that may need replay after a failure. In practice, checkpoint intervals should line up with your internal RTO and RPO targets.
Processed data then lands in stores and caches built for fast downstream reads. The best choice depends on the query pattern.
| Storage Option | Typical Read Latency | Best Write Pattern | Scaling Model | Operational Complexity |
|---|---|---|---|---|
| Redis | Sub-millisecond to a few ms | Hot-key reads, session data | Horizontal sharding, clustering | Medium - requires eviction policy and HA setup |
| DynamoDB / Cassandra | Single-digit to tens of ms | High write throughput, key-based lookups | Horizontal partitioning, auto-scaling | Medium to High - partition design and capacity tuning |
| ClickHouse / BigQuery | Tens to hundreds of ms | Batched or micro-batched analytical writes | Distributed MPP, elastic scale | Medium - query tuning and cost control |
| PostgreSQL with replicas | Low-ms reads from replicas | Transactional writes, complex queries | Vertical scale plus read replicas | Medium to High - replication and failover management |
| Elasticsearch / OpenSearch | Low to tens of ms | Text search, log analytics | Sharded indices, cluster scaling | High - index lifecycle and cluster tuning |
A simple rule of thumb helps here: use Redis for hot materialized views, DynamoDB for high-write key-value access, and ClickHouse for analytical scans.
After state and storage are set, the next step is dealing with duplicates, retries, and the mess that failures tend to leave behind.
Idempotency, Retries, and Failure Recovery
You should assume at-least-once delivery. In plain terms, duplicates will happen. Design for them from day one.
Give every message a unique event ID. For external actions, use idempotency keys. For internal writes, use UPSERTs or dedup logs.
At the broker level, Kafka producers should use acks=all and enable.idempotence=true. That gives you idempotent retries during production. For retry policy, use exponential backoff with a cap. If failures keep happening, send the event to a DLQ along with the attempt count and error type.
For recovery, restore stateful processors from the last successful checkpoint and replay from that offset. Then test failover across U.S. regions using live traffic so you can verify actual RTO and RPO behavior, not just what looks good on paper.
Deploy, Monitor, and Scale in Production
Once recovery is set, production work moves to three day-to-day concerns: safe releases, clear visibility, and scaling that matches load.
Provision Infrastructure and Deploy Safely
Define Kafka, Kubernetes, storage, networking, and IAM in version-controlled IaC. Keep development, staging, and production separate - best case, each lives in its own account or project with its own networking, clusters, data stores, and IAM boundaries. That separation helps keep test traffic and half-finished changes from spilling into production and hurting SLAs.
For deployments, use the rollout method that fits the level of risk. Rolling updates are fine for lower-risk changes. Blue-green deployments make rollback fast when downtime needs to stay close to zero. Canary releases work especially well for stream processor updates: send 1%–5% of traffic to the new version, watch lag and error rates, and then increase traffic step by step.
Don’t size production from gut feel. Size it from load tests. For the first release, add 30%–50% headroom. Then check that buffer against p95 latency and consumer lag, not rough estimates.
Monitor Lag, Latency, Errors, and Backpressure
Real-time observability comes down to three things: metrics, logs, and traces. Metrics tell you that something is off. Logs help explain why. Traces show where the slowdown or failure happened.
For metrics, Prometheus with Grafana is a common setup. Watch consumer lag by partition and consumer group, p95 and p99 end-to-end latency, throughput by topic, error rates, DLQ volume, and resource saturation across CPU, memory, disk I/O, and network throughput. Buffer use and backlog age can warn you about backpressure before lag jumps.
Centralize logs with structured fields and correlation IDs so a failed record can be tied back to the event that triggered it. Add distributed tracing with a tool like Jaeger or OpenTelemetry for span-level visibility across ingestion, processing, and serving layers.
| Metric / Focus | Observability Category | Typical Dashboard View |
|---|---|---|
| Consumer lag per partition | Metrics (time series) | Line chart by consumer group and topic |
| p95 / p99 end-to-end latency | Metrics + Traces | Latency percentile chart plus trace waterfall |
| Error rate, DLQ volume | Metrics + Logs | Error count by service, DLQ messages over time |
| CPU, memory, disk I/O | Metrics | Node/pod resource utilization heatmap with alerts |
| Backpressure signals | Metrics | Service-specific backpressure graphs and thresholds |
| Throughput (events/sec) | Metrics | Events per second by topic and service |
| Slow queries / API spans | Traces + Logs | Trace explorer with span durations and correlated logs |
Set alerts on lag growth rate, not only on the raw lag number. Lag often traces back to hot partitions or slow state stores, so break it out by topic, partition, and consumer group. If your system has a 2-minute action window, sustained lag past 60–90 seconds should trigger immediate investigation. A jump in DLQ volume right after a deployment often means a logic bug or a schema mismatch, so it helps to have a triage process that reviews DLQ samples every day.
Those same signals should also drive scaling decisions.
Autoscaling and Capacity Planning
CPU-based autoscaling is fine for simple stateless services. For stream consumers, it’s usually better to scale on lag or backlog.
Tools like KEDA can scale consumer pods straight from Kafka lag or queue depth, which ties replica count to actual backlog and SLA risk. In the processing layer, custom-metric policies with Prometheus or Datadog can scale from backpressure signals, events per second, or p95 latency - whichever lines up best with your SLO.
| Autoscaling Strategy | Responsiveness | Stability | Implementation Complexity |
|---|---|---|---|
| CPU / Memory Based | Medium | High | Low - standard Kubernetes HPA |
| Lag-Based (e.g., KEDA + Kafka) | High | Medium | Moderate - requires metric exporter setup |
| Custom Metric (queue depth, p95 latency) | High | Moderate | High - custom Prometheus queries or Datadog integration |
To keep scaling from bouncing up and down, set cool-down periods of 5–10 minutes between scaling decisions. Define minimum and maximum replica counts, and use different thresholds for scale-out and scale-in. Scale out when CPU goes above 60% to 70% or when lag crosses your backlog threshold. Scale in only when use falls below 30% to 40% and stays there.
Scale the bottleneck layer, not the entire stack. Find the hotspot - maybe a few partitions or one service pulling far more resources than the rest - and then decide whether you need more nodes, larger nodes, or code changes. It also helps to pair resource metrics with a cost-per-1,000-events figure. That gives budget owners a plain way to compare scaling out against tuning processing logic before adding more monthly spend. Use those numbers to keep the system inside SLA as load and partition behavior shift.
Apply the System to Automation Use Cases and Review the Build Path
Support AI Automation, Dashboards, and Real-Time Decisions
Once the pipeline is stable in production, the next step is simple: line it up with the workflows it needs to handle. At that point, the big question isn't whether the system works. It's whether it works fast enough for the job.
That matters because the last few design calls shape the outcome. The right setup can keep automation moving in milliseconds. The wrong one can slow the whole thing down.
A fraud system reached sub-10 ms p99 latency and cut fraudulent transactions by 83%. A supply-chain platform handling 3 million shipments a day reduced alert time from hours to minutes.
The same pipeline patterns show up across fraud, agents, IoT, dashboards, and contact centers. But they don't all use the exact same stack.
| Automation Use Case | Architecture Pattern | Storage Choice |
|---|---|---|
| Fraud Detection | Event-Driven Streaming | Redis or another low-latency key-value store |
| AI Automation / Autonomous Agents | Event-Driven (EDA) | Vector database, online feature store |
| IoT / Equipment Monitoring | Kappa (stream-centric) | Time-series database |
| Logistics Visibility | Kappa + Real-Time OLAP | Time-series database or OLAP store |
| Live Dashboards | Kafka or Pub/Sub, stream processing, metrics pipeline | Prometheus or another metrics store |
| Contact Center Workflows | Event-Driven (EDA) | Document database, vector database |
For AI automation, event streams feed an online feature store, get scored in-line, and then route actions right away. Voice agents and autonomous agents can query a vector database in real time. At the same time, drift and error monitors can trigger retraining or rollback before small issues turn into bigger ones.
Conclusion: Key Design Rules for Scalable Real-Time Systems
These use cases all point back to the same build rules, no matter the domain.
Keep six rules in play:
- Set SLOs first
- Choose Lambda or Kappa early
- Partition by the business entity
- Build idempotency and recovery in from day one
- Treat observability as a core feature
- Scale from measured load, not estimates
NAITIVE AI Consulting Agency helps teams design, build, and manage AI automation, autonomous agents, voice agents, and business process automation when end-to-end ownership matters.
FAQs
How do I choose between Lambda and Kappa?
Choose based on whether you want a simpler setup or need batch processing for specific jobs.
Lambda keeps batch and streaming in separate layers. That can help when you need a dependable historical record and real-time updates at the same time.
Kappa runs on a single streaming layer. That makes the system simpler, cuts duplicate code, and keeps AI systems working from the latest data.
What is a good partition key for streaming data?
The provided information does not include guidance on how to choose a partition key for streaming data.
If you need architecture guidance or help with streaming setup, NAITIVE AI Consulting Agency can help design real-time data solutions for your infrastructure.
When should I scale consumers based on lag?
It depends on the workload.
For background agent task queues, scale based on queue depth. Tools like KEDA work well here, with sources such as Kafka or Redis Streams, because queue depth shows the backlog directly.
For latency-sensitive interactive agents, scale based on p95 latency with Horizontal Pod Autoscalers and custom metrics. If p95 latency goes above your target, add replicas to keep performance steady.