AI Agent Observability for Enterprises
Enterprise AI agents must be fully traceable: traces, logs, metrics and evaluations tied to a run ID ensure safety, cost control, and compliance.
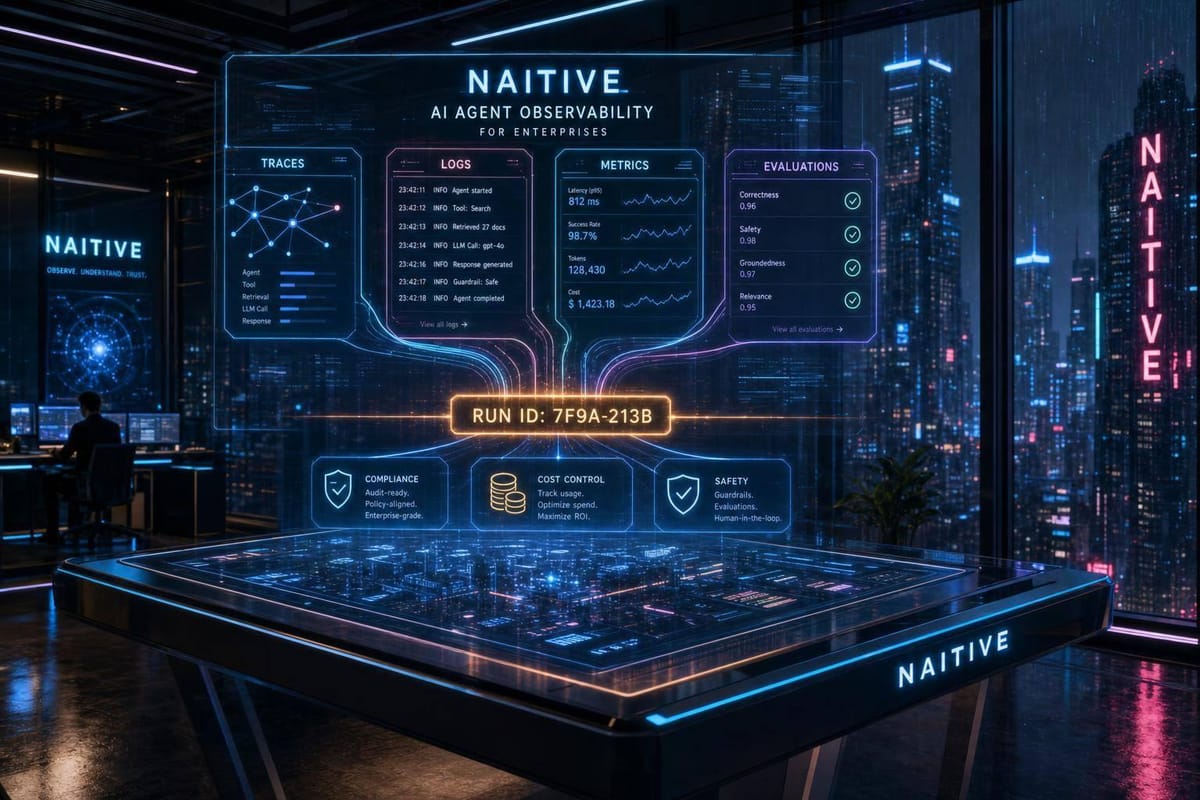
If you can’t trace one agent run end to end, you can’t prove it is safe, correct, or worth the cost. In 2024, the AI Incident Database logged 233 reported AI incidents, up 56.4% from 2023. To reduce that risk in enterprise use, I’d focus on four things: traces, logs, metrics, and evaluations tied to the same run ID.
Here’s the short version:
- I’d use traces to see each step: retrieval, model call, tool use, retry, handoff, and final output
- I’d use logs for audit records, policy checks, errors, and event-level detail
- I’d use metrics to track latency, throughput, retry rate, token use, and cost per run
- I’d use evaluations to score task success, output quality, and safety
- I’d keep raw prompts, transcripts, and documents out of telemetry
- I’d add runtime policy checks, access controls, and tamper-evident records for regulated work
- I’d start with one low-risk workflow, baseline current results, then expand with the same schema and controls
A few signals matter most when I want to know if an agent can scale without causing problems:
- p95/p99 latency
- tool failure rate
- forced escalation rate
- policy violation rate
- task success rate
- cost per successful task
- downstream process completion
Quick comparison:
| Area | What I’d track | What it tells me |
|---|---|---|
| Traces | Step-by-step run path | Where the run slowed, failed, or took the wrong path |
| Logs | Events, errors, policy results | What happened at a given moment |
| Metrics | Latency, volume, retries, cost | Whether the system stays stable and within budget |
| Evaluations | Success, quality, safety | Whether the agent did the job well |
The main point is simple: enterprise observability is not just uptime tracking. It is a way to connect behavior, risk, performance, and business results across every agent run.
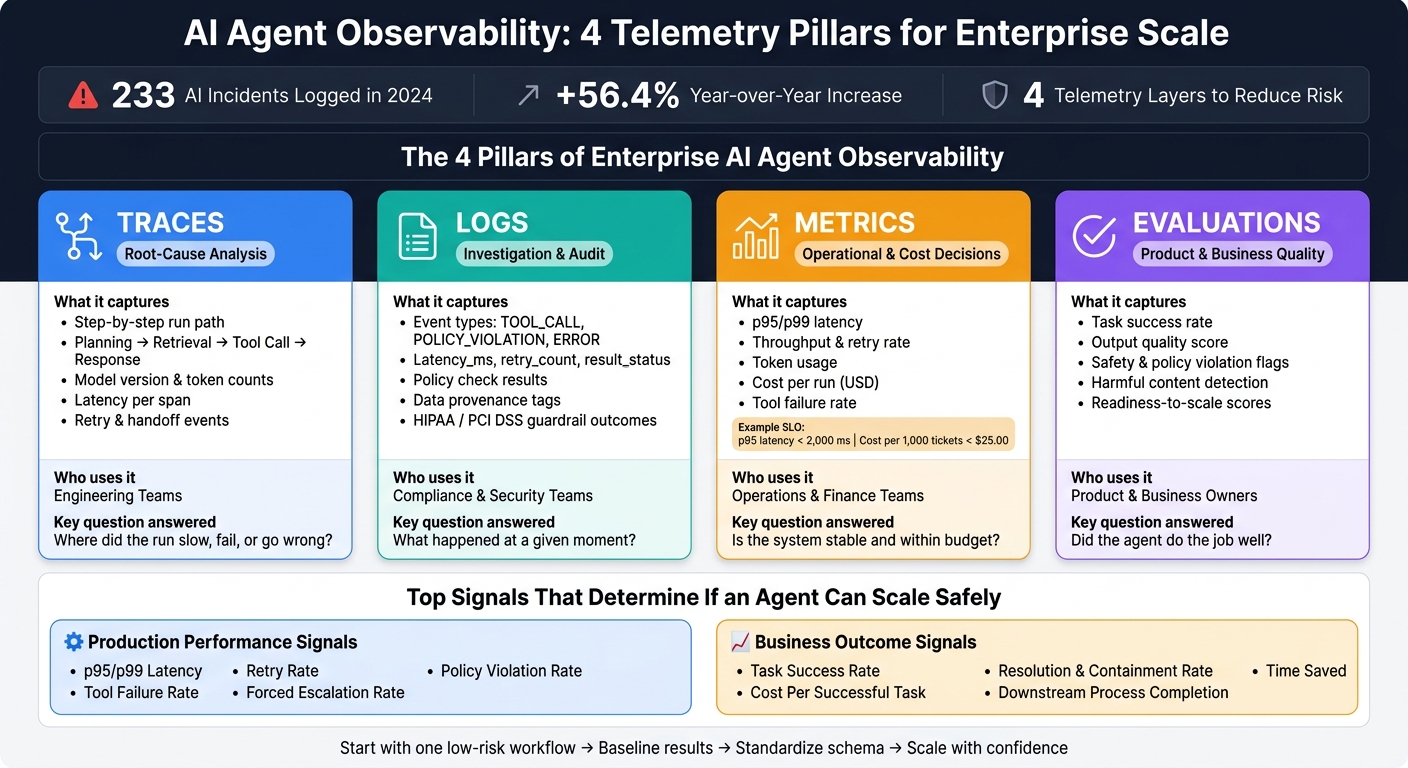
AI Agent Observability: 4 Telemetry Pillars for Enterprise Scale
Why AI Agents Need Their Own Observability Layer | AWS | Arize Observe 2026
sbb-itb-f123e37
Core Telemetry Foundations for AI Agents
Enterprise observability starts with four telemetry layers: traces, logs, metrics, and evaluations. Many teams rely on OpenTelemetry GenAI semantic conventions. Each layer answers a different operational question. Put them together, and you get a clear view of how an agent behaves in production across teams, releases, and workflows.
What to Capture in Traces, Logs, Metrics, and Evaluations
Traces are the backbone. Every agent run should create a distributed trace of spans that maps each step the agent took: planning, retrieval, LLM reasoning, tool invocations, workflow transitions, retries, and handoffs. Each span should include model version, token counts, latency, tool calls, retrieval provenance, and status codes.
There’s one rule here that matters a lot: prompts stored in traces should be sanitized or templated, not copied in raw form. That helps keep sensitive data out of the observability stack.
Traces show the path of a run. Logs show the exact event behind a failure or policy hit.
Logs record individual events. A structured log entry should include fields such as agent_run_id, event_type (for example, TOOL_CALL, POLICY_VIOLATION, or ERROR), tool_name, latency_ms, retry_count, result_status, and policy_check_result.
In regulated enterprises, it also helps to record data_provenance tags and guardrail outcomes like HIPAA_guardrail_passed: true. That structure gives security and operations teams a clean way to run precise queries for incident response and audit trails.
Metrics show speed and cost. Evaluations show whether the agent solved the task.
Metrics turn trace data into dashboard-level signals. The main ones to track are throughput, end-to-end and per-step latency, token usage, failure and retry rates, and cost per run in USD. These signals show whether an agent can take on more volume without service slipping.
A practical SLO might look like this:
"p95 end-to-end latency < 2,000 ms" and "cost per 1,000 completed tickets < $25.00."
Evaluations attach quality and safety scores directly to traces and run IDs. They measure task success, output quality, and safety, including harmful content or policy violations. These scores help teams decide whether an agent is ready to move past a pilot and into broader production use with specialized AI consulting. They also make it easier to tie poor outcomes back to a specific prompt version, retrieval source, or tool configuration.
How Each Telemetry Pillar Serves a Different Enterprise Goal
Each pillar answers a different question for a different team. Traces help engineers find where something broke. Logs help compliance and security teams understand what happened and why. Metrics help operations and finance teams manage performance and cost at scale. Evaluations help product and business teams judge whether the agent is delivering value.
| Telemetry Pillar | Purpose | Example Data | Value |
|---|---|---|---|
| Traces | Root-cause analysis | Span tree: Planning → Retrieval → Tool Call → Response; latency per span; model version | Pinpoints which step caused a slowdown |
| Logs | Investigation and audit | TOOL_CALL event with latency_ms, retry_count, policy_check_result, data_provenance |
Supports compliance audits and incident response |
| Metrics | Operational and cost decisions | p95 latency, cost per run, token usage, failure rate, throughput | Enables SLO management, capacity planning, and budget control |
| Evaluations | Product and business quality | Task success rate, quality score, safety-flag rate | Determines readiness to scale or automate additional workflows |
These foundations feed the signals used to measure agility and scale. Together, they show the exact step that needs fixing.
Signals That Measure Agent Agility and Scalability
Once traces, logs, metrics, and evaluations are in place, the next move is to decide which signals show whether agents can grow safely. Telemetry gives you the raw data. These signals tell you if an agent can take on more work without slipping on reliability or business impact.
Production Performance Signals
Production performance signals show whether an agent can handle more volume without falling apart. The main ones to track are latency, throughput, retry rate, handoff rate, escalation frequency, tool failure rate, and policy violation rate.
A scalable agent keeps latency steady as throughput goes up. If latency jumps when volume climbs, you’re likely looking at a bottleneck in model inference, orchestration, or a downstream tool.
Retry rate is one of the earliest warning signs. When retries climb under load, that usually points to instability in tools, models, or integrations. Tool failure rate is easy to misread as an AI quality issue, even when the root cause sits downstream. Tracking it on its own helps teams fix the actual problem instead of chasing the wrong one.
Handoff rate and escalation frequency show where agent autonomy starts to crack. Planned handoffs and forced escalations should be tracked separately. If forced escalations keep rising, the agent is struggling as volume grows.
Policy violation rate carries extra weight in regulated industries. As agents take on more requests and more varied work, violations need to stay flat or move down. For regulated workflows, set a hard threshold and trigger an automatic rollback if the agent crosses it.
Operational stability tells only part of the story. The next layer is whether that stability turns into business results.
Business Outcome Signals for Enterprise Value
Production signals tell engineers if the system is stable. Business outcome signals tell executives if the investment is paying off by measuring ROI, efficiency gains, and end-to-end workflow completion.
The key business outcome signals are task success rate, resolution rate, cost per successful task, time saved, containment rate, and downstream process completion.
Task success rate measures whether the agent finished the work correctly, not just whether it returned an answer. Resolution rate looks at customer-facing interactions and asks: what share was fully resolved without a follow-up or human handoff? Containment rate tracks how many interactions the agent handles from start to finish.
Cost per successful task ties agent performance to financial results. Calculate it by dividing total monthly costs - infrastructure, model inference, licensing, and human oversight - by the number of tasks that meet your success criteria.
Downstream process completion helps avoid a common trap: an agent that looks successful on the surface but doesn’t move the business forward. If the next step never happens, the job wasn’t done. Tracking downstream completion closes that gap.
The table below separates these two signal groups and shows who should use each one and why.
| Signal Category | Example Metrics | Primary Users | How It's Used |
|---|---|---|---|
| Production Performance | Latency (p95/p99), throughput, retry rate, handoff rate, escalation frequency, tool failure rate, policy violation rate | Engineering, SRE, ML Ops | Detect bottlenecks, ensure reliability, validate safe scaling under load |
| Business Outcome | Task success rate, resolution rate, cost per successful task, time saved, containment rate, downstream process completion | Executives, Operations, Finance | Evaluate ROI, measure efficiency gains, justify expansion decisions |
Technical teams should build dashboards around production signals, with alert thresholds tied to SLOs. Executives should watch business outcome signals in scorecards tied to OKRs. When both sets of signals improve at the same time, that’s the clearest sign an agent is ready to scale.
Next, instrument these signals so every run can be measured the same way across teams and systems.
How to Instrument AI Agents for Production Visibility
Signals only help if you can follow a run from start to finish. The best way to do that is to instrument each run as a single trace. That lets you join signals, logs, and outcomes across systems, so latency, retry rate, handoff rate, and outcome labels all point back to one record you can query. That shared trace model is what ties production signals to business results.
Minimum Event Schema for Agent Runs
A consistent event schema is what makes traces useful across teams, environments, and workflows at enterprise scale. Track the main run lifecycle from start to finish:
- request received
- context assembly
- retrieval
- LLM call
- tool call
- guardrail check
- state transition
- retry
- human escalation
- final response
- outcome label
Each event in that chain should carry the same core fields: event_id, event_type, trace_id, run_id, session_id, user_id (where permitted), service_name, component, and step_index.
Timestamps need to match across systems. For example, 08/19/2026 10:02:15 AM ET. At the same time, store UTC internally for computation. The metadata field should hold step-level details like latency_ms, retrieval_docs_count, guardrail_rule_id, token_count, retry_count, and error_code. That keeps each event self-contained without stuffing too much into the core schema.
Keep raw transcripts, full prompts, and documents out of telemetry. Store references such as document IDs instead, and keep the actual content in secure storage with strict access controls.
Once the schema is fixed, teams can instrument the same run in the same way.
Instrumentation Patterns for Enterprise Systems
API gateways should generate or validate trace_id on every inbound request, then inject it into HTTP headers like trace-id or x-request-id so it moves downstream by default. Workflow engines should pass trace_id and run_id in task payloads, with each state or task represented as its own span carrying attributes such as workflow_name, task_type, and attempt.
Retrieval systems - vector stores, keyword search, and internal knowledge bases - should read trace_id from inbound calls and include it in their own logs and metrics. Useful span attributes here include retrieval_type, index_name, docs_returned, and latency_ms. Customer-facing channels - web, mobile, IVR, and voice agents - should include session_id and trace_id in every request sent to the agent backend so front-end events line up with backend spans.
For LLM calls, OpenTelemetry's GenAI semantic conventions define standard attributes and metrics such as gen_ai.request.model, gen_ai.client.operation.duration, and gen_ai.client.token.usage. That helps keep telemetry portable across the observability stack.
A practical setup is to use auto-instrumentation for HTTP, databases, and APIs, then add custom spans for retrieval, guardrails, and tool calls. That cuts manual work while still giving teams the level of detail they need in production.
Operating Model for Rollout Across Teams
Scaling observability takes clear ownership, not just shared tooling. When ownership is fuzzy, standards drift and coverage starts to break across teams.
Four groups need to work as one control system:
- Platform teams define event schemas, naming conventions, required IDs, and timestamp formats. They also build shared SDKs and middleware and run the centralized observability stack.
- Application teams plug those libraries into agents, workflows, and tools. They also add domain-specific outcome labels like
ticket_resolvedorloan_approvedso agent behavior can be tied to business metrics. - Security and compliance teams review schemas for data minimization, set retention policies, enforce encryption, and audit log access against U.S. regulations like HIPAA or PCI DSS.
- Business owners define which success metrics must be captured and approve the outcome labels that feed executive dashboards.
Together, these roles keep instrumentation consistent from pilot through enterprise scale.
Governance, Security, Rollout, and Conclusion
Governance and Security Controls for Agent Observability
Observability turns into a governance system when every run is tied to identity, time, and policy outcome.
That means logging who started the run, which model version ran, which tools the agent used, and what policy result came back. Those records should live in append-only, tamper-evident logs. For critical records, hash-chaining or integrity attestation helps show if anything was changed later. That matters when regulators ask for proof under SOC 2 CC7.2, HIPAA, or PCI DSS.
Access control needs to connect straight to your enterprise identity provider through SAML or OIDC. Different people need different levels of detail:
- A security analyst should see redacted sensitive payloads
- A developer should get debugging detail without raw PII
- A business owner should get outcome dashboards without raw trace access
You also need to log every access to observability data. If access isn't logged, it's hard to prove your controls work.
Policy enforcement should happen at runtime, not after the fact. If an agent tries a high-risk action - say a transfer above $1,000 or an external email attachment that hasn't been reviewed - the system should evaluate that action at execution time and record the policy ID, evaluation result, and any remediation as observable events.
When a high-risk action triggers review, that whole workflow should show up in the trace: the request, the reviewer's decision, and any override. That's how you prove safeguards are being enforced, not just written down in a policy doc. Traceable approvals and overrides also make rollout smoother in regulated workflows, so compliance doesn't turn into a drag as usage grows.
Phased Rollout: From Pilot to Enterprise Scale
With controls in place, the next move is simple: start with a low-risk workflow.
Pick one workflow with a clear business outcome and manageable risk, like internal IT helpdesk triage, invoice processing, or one customer support queue. Before the agent goes live, measure the baseline. Track average handle time, escalation rate, and cost per interaction in USD. Those numbers become your reference point for the calls you make later.
Once the pilot is instrumented and stable, expansion is about standardization, not rebuilding the same setup again and again. New workflows should inherit the same event schemas, guardrail templates, and governance checklists instead of starting from scratch.
| Dimension | Pilot Rollout | Enterprise Scale-Up |
|---|---|---|
| Scope | One workflow, limited users | Dozens of workflows across multiple business units |
| Telemetry depth | Core traces and logs for primary flows | Standardized schemas, richer metrics, and evaluations across all agents |
| Governance | Local approvals, simple policies | Formal AI governance framework, AI risk committee, shared guardrails |
| Security controls | Basic RBAC, encrypted logs, initial PII redaction | Fine-grained RBAC, data-class policies, SIEM/SOAR integration |
| Compliance | Informal mapping to relevant standards | Audit-ready for SOC 2, ISO 27001, and HIPAA or PCI DSS where applicable |
| Cost tracking | Single use case, basic monthly summaries | Per-workflow dashboards with forecasting and budget controls |
Before production go-live, set alerts for:
- Error-rate spikes
- p99 latency breaches
- Session cost above the ceiling
Conclusion: Key Building Blocks of Enterprise AI Agent Observability
Once the pilot is stable, observability becomes the way teams expand safely.
The work that makes this stick is mostly organizational, often requiring an Agentic foundation to align technical and business goals. You need consistent event schemas owned by a central platform team, outcome metrics set by business owners, security and compliance sign-off on controls, and governance reviews that treat agent behavior data with the same seriousness as financial or security data.
That operating model, paired with a phased rollout that starts small, validates early, and standardizes before scale-up, is what separates enterprises that can expand AI agent use with confidence from those that pile up risk they can't see. These controls help enterprises scale agents faster without giving up auditability, reliability, or cost discipline.
FAQs
How do I choose the first agent workflow to instrument?
Start with a workflow that’s less critical to day-to-day business operations. That gives your team room to test, learn, and fine-tune observability before rolling it out in higher-stakes settings.
At first, focus on a small set of core metrics:
- automated resolution rates
- first contact resolution
- human override rates
- end-to-end resolution time
- cost per decision
This gives you a practical baseline before you move into more complex or higher-risk workflows.
What data should never be stored in AI agent telemetry?
Do not store raw prompts or response content in AI agent telemetry at scale. They can contain PII, trade secrets, or other private business data.
That creates a bad pattern fast: your telemetry system turns into a second copy of sensitive information.
A safer path is to store protected representations instead. For example, keep SHA-256 hashes of inputs and outputs, then use redaction so logs still help with auditing and debugging without exposing the underlying content.
You still get the signal you need. You just don’t keep the raw data sitting around where it doesn’t belong.
How do I tie agent performance to business ROI?
Tie agent performance to business ROI by looking at outcomes, risk, and financial impact, not just technical activity. The goal isn't to track activity for its own sake. It's to show whether the agent saves time, cuts cost, and reduces mistakes in ways the business can measure.
Start with a baseline built from 12 months of historical data. Include manual processing time, operating costs, and error rates. That gives you a clear before-and-after view, so you're not guessing whether the agent made a difference.
Then connect technical telemetry to financial KPIs, such as cost per interaction or cost per decision. Metrics like latency and tool-call success rates shouldn't sit in a dashboard by themselves. Tie them to business SLAs, task resolution rate, and average handle time so you can see how system behavior affects dollars, service levels, and day-to-day work.