Best Practices for AI Log Analysis
Structured, centralized AI logging is essential to trace model behavior, ensure compliance, and control costs.

AI log analysis is critical for ensuring the reliability, security, and compliance of systems leveraging artificial intelligence. Unlike traditional software, AI often fails quietly, making robust logging practices indispensable for identifying subtle issues like model drift, bias, or hallucinations. Here's a quick breakdown of the key takeaways:
- Focus on Goals: Define objectives like performance, quality, security, and cost control to guide logging practices.
- Log Essentials Only: Avoid logging everything to control storage costs. Prioritize metadata like token counts, response times, and error rates.
- Separate AI Logs: Distinguish AI-specific logs (e.g., prompts, responses, model IDs) from general system logs for better traceability.
- Structured Logging: Use consistent formats like JSON for easier querying and analysis.
- Compliance Ready: Align logging with U.S. regulations like HIPAA and SOC 2 by ensuring audit trails are immutable and timestamps are standardized.
- Centralize Logs: Use tools like Kafka or Amazon Kinesis to manage and aggregate logs efficiently.
- AI Monitoring: Leverage AI-based anomaly detection to identify issues faster and reduce alert noise.
These practices help organizations maintain reliable AI systems while meeting compliance and governance requirements. If you're struggling with traceability, security, or cost visibility, our AI automation agency can help you refine your logging strategy.
AWS re:Invent 2024 - Best practices for generative AI observability (COP404)
sbb-itb-f123e37
Define Your AI Log Analysis Goals and Scope
Start by Clearly defining your log analysis goals to avoid unnecessary data collection and inflated storage costs, often with the help of AI consulting services. These objectives will shape how you structure and prioritize your logging practices. The most effective AI logging strategies revolve around four main business goals: performance and uptime, model quality, security, and cost control. Each of these aligns with specific metrics, helping you differentiate AI-specific logs from general system logs.
| Pillar | Key Metrics to Prioritize | Business Objective |
|---|---|---|
| Performance | Latency (p99), Error Rate, Throughput | Uptime and Reliability |
| Quality | Accuracy, Hallucination Rate, User Ratings | Model Trust and User Experience |
| Cost | Token Usage, API Spend, Cost per Interaction | Financial Sustainability |
| Security | Anomaly Spikes, PII Access, Failed Logins | Threat Protection |
Tell AI-Specific Logs Apart from General System Logs
General system logs capture routine and predictable details like CPU usage, memory stats, and disk I/O. On the other hand, AI logs focus on the dynamic reasoning process - they track prompts, model responses, tool usage, and execution times. Combining these logs can make debugging more difficult.
AI-specific logs typically fall into four categories:
- Model inference logs: Include prompts, responses, token counts, and model IDs.
- Data pipeline logs: Cover data retrieval, memory storage, and preprocessing activities.
- Infrastructure logs: Monitor GPU/TPU usage and container lifecycle events.
- User interaction logs: Record explicit feedback (e.g., thumbs up/down) and implicit signals (e.g., text copied from responses).
Organizing these logs early ensures smoother incident resolution.
"When an AI agent goes wrong... you need to know exactly what happened, in what order, with what inputs, and what the outputs were. Without comprehensive audit trails, incident response is guesswork." - AgentNode Blog
Decide What to Log
Once your goals and categories are clear, focus on logging only the essentials. Logging everything leads to ballooning costs and inefficiency. Over the past five years, enterprise log volumes have grown by 250% annually, and storing raw prompts and responses at scale quickly becomes unsustainable.
For production, log at the INFO level to capture metadata like token counts, model names, finish reasons, and step completions. Use DEBUG level logs sparingly for troubleshooting. To maintain audit integrity, store input/output hashes. Each tool invocation should include fields such as:
trace_idagent_idtool_nameinput_hashoutput_hashduration_mspermissions_used
These details are critical for reconstructing events during investigations.
Plan for U.S. Compliance and Governance
U.S. regulations impose specific requirements for logging practices. For example:
- SOC 2: Requires monitoring for unauthorized changes with a minimum 12-month retention.
- HIPAA: Demands detailed audit trails for all access to protected health information (PHI), ensuring logs are stored separately from the PHI itself.
- SOX and PCI-DSS: Mandate immutable audit trails (e.g., through WORM storage or cryptographic chaining) with retention periods of up to 7 years.
Standardize all log timestamps in UTC to avoid time zone inconsistencies during incident response. Additionally, assign logs to the appropriate stakeholders early on:
- DevOps teams: Responsible for monitoring infrastructure stability logs.
- ML engineers: Need access to inference and retrieval traces.
- Business leaders: Require concise summaries of cost and quality metrics, not raw log data.
Build a Well-Structured Logging Strategy
Once you've outlined your objectives, the next step is to create a reliable logging structure that supports compliance, traceability, and performance. A well-thought-out logging approach ensures your data is both useful and manageable, keeping it readable and easy to query while minimizing any impact on system performance.
Set the Right Logging Levels and Detail
Capturing the right amount of data is key - too much logging can overwhelm storage and obscure important insights. For production environments, stick to INFO as the default logging level and save DEBUG for active troubleshooting. Here's how different logging levels align with common AI-related events:
| Level | When to Use It | AI-Specific Example |
|---|---|---|
| DEBUG | For development and troubleshooting | Full prompt contents, raw LLM responses, tool arguments |
| INFO | Default for production | Step completion, token counts, model name, finish reason |
| WARNING | For unexpected but recoverable events | Retries, fallback model usage, slow LLM responses |
| ERROR | For failures that require investigation | Tool failures, LLM timeouts, validation errors |
| CRITICAL | For unrecoverable system issues | Agent loop crashes, unauthorized data access |
If you need DEBUG-level data in production for a specific issue, consider sampling instead of logging every request. Capturing just 1% to 10% of requests can provide the insights you need without overwhelming the system. When implemented correctly, logging should add no more than 5 milliseconds of latency per request.
Once you've set appropriate logging levels, focus on structuring your logs consistently to enable quick and precise queries.
Use Structured Logging Formats
Structured logs, especially in JSON format, make it easy to retrieve data with a single query, eliminating the need to sift through endless plain-text logs.
"The difference between 'User login failed' and a JSON object... is the difference between searching through thousands of logs manually and running a single query." - Nawaz Dhandala, OneUptime
For AI systems, every log entry should include a standardized set of fields. Stick to snake_case for field names across all services - mixing formats like user_id, uid, and userId complicates cross-service queries. Some essential fields to include are:
timestamp(use ISO 8601 in UTC with millisecond precision)serviceenvironmentmodel_idevent
Tools like Python's structlog can help you automatically bind contextual fields - like conversation_id and user_id - to every log entry, ensuring consistency across all services.
Don't overlook model versioning. Every log entry should document the model provider, version, temperature setting, and guardrail configuration. Without this information, reproducing errors or auditing decisions becomes nearly impossible.
Protect Privacy and Maintain Traceability
While organizing your logs is essential, you also need to ensure sensitive information is protected. Logging raw prompts and responses at scale can create a secondary repository of sensitive data, which requires its own strict security measures.
"Storing raw inputs and outputs in audit logs creates a secondary data store that must be secured, classified, and governed. Hashes let you verify what data was processed without duplicating the data itself." - AgentNode
To avoid storing sensitive data unnecessarily, use SHA-256 hashes of inputs and outputs instead of raw values. This approach lets you verify what data was processed without creating additional vulnerabilities. Pair this with automated redaction tools to strip out personally identifiable information (PII) like email addresses, Social Security numbers, and API keys before logs are saved.
Finally, include a trace_id in each log entry to link related events. A Q1 2026 survey of 420 organizations revealed that 83% could not reconstruct the full sequence of tool calls and reasoning when an AI agent failed. Traceability ensures you can piece together what happened when something goes wrong.
Centralize Log Collection and Management
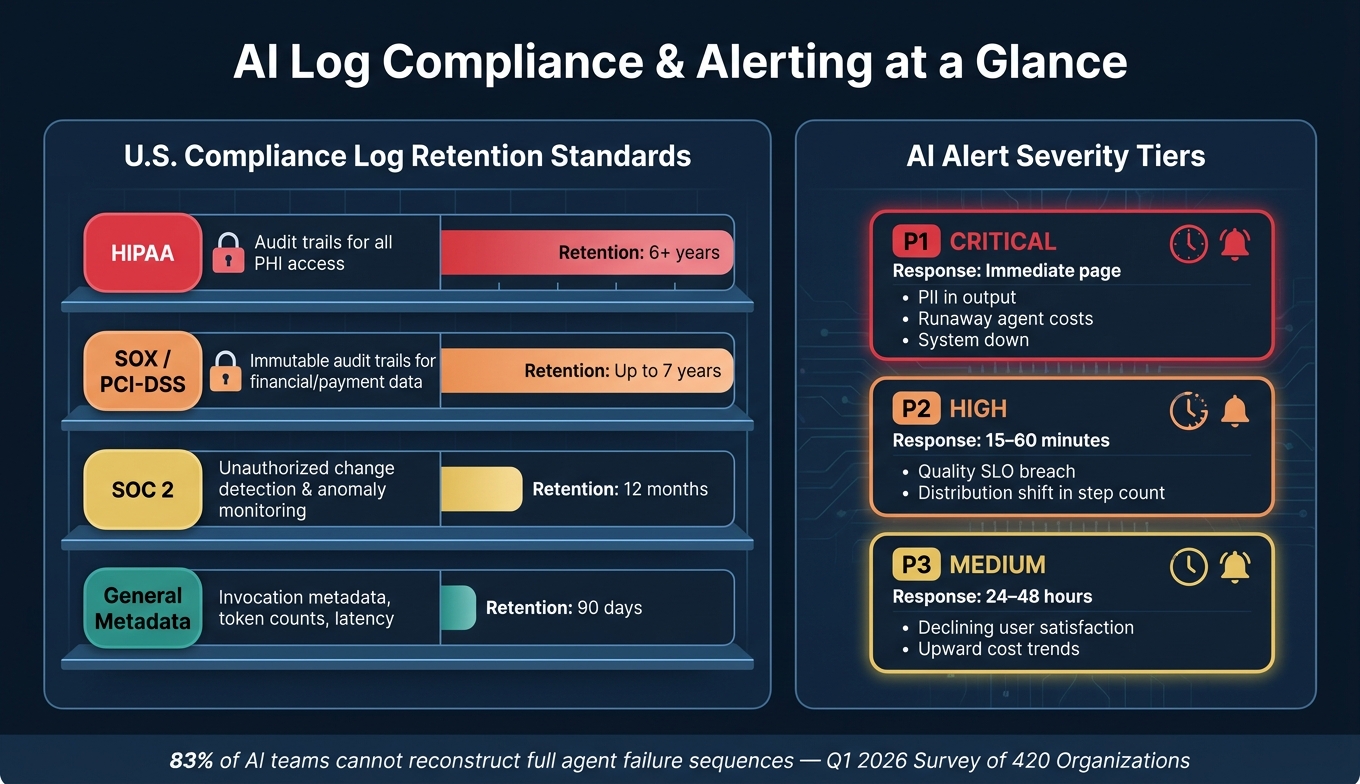
AI Log Analysis: Compliance Retention Requirements & Alert Severity Tiers
When AI systems rely on multiple services, logs can quickly become scattered across various tools and platforms. In 2023, about 37% of enterprises reported ingesting over 1 terabyte of log data daily, with some large-scale setups surpassing 10 terabytes per day. Without a centralized system, correlating this dispersed data during an active incident can take more than 30 minutes. A proper system for collecting and managing logs is essential to streamline operations and minimize delays.
Centralized logging also strengthens traceability and compliance measures, offering a unified perspective across all services.
Set Up a Centralized Logging Pipeline
A well-designed logging pipeline consists of three coordinated layers:
- Agent Runtime Logger: Captures events directly at the source in real time.
- Log Aggregation Pipeline: Processes and routes data asynchronously.
- Query/Analysis Platform: Provides long-term storage and integrates with tools like SIEM for monitoring and analysis.
To ensure smooth processing between the runtime and aggregation layers, use a durable message queue like Kafka, Amazon Kinesis, or Google Pub/Sub. These tools help manage backpressure and prevent log loss during high-traffic periods.
"A log line without context is a timestamp and a shrug." - Simran Kumari, OpenObserve
Every log entry should include a trace_id, which links events across services, offering clear insights into an AI agent’s activities throughout its lifecycle.
Control Performance and Costs
Log data can grow at an astonishing rate. In many cloud environments, annual log volume increases by over 30%. If unchecked, this growth can lead to spiraling costs. To manage expenses, consider these strategies:
- Tiered Storage: Keep recent logs in hot storage for quick access, move older logs to warm storage, and archive compliance-related records in cold storage.
- Sampling and Filtering: Reduce ingestion costs by up to 25%. For example, sample only 1% of non-error traces to retain meaningful data while avoiding unnecessary overhead. Reserve full logging for errors and security-critical events.
Once you’ve optimized log collection and storage, the next step is to ensure the data is secure and properly governed.
Set Up Governance and Security Controls
Log data often contains sensitive information, so access should align with the sensitivity of the content. For example:
- Invocation Metadata: Details like timestamps, token counts, and model IDs can be shared with ML platform teams.
- Prompt and Response Content: Since this may include PII or proprietary data, access should be limited to security teams.
Role-based access control (RBAC) can help enforce these boundaries, ensuring operational visibility without compromising sensitive information.
For organizations operating under U.S. compliance frameworks, storage requirements vary by regulation. Here’s a breakdown:
| Regulation | Logging Requirement | Recommended Retention |
|---|---|---|
| HIPAA | Audit trails for all access to Protected Health Information (PHI) | 6+ years |
| SOC2 | Detection of unauthorized changes and anomaly monitoring | 12 months |
| SOX / PCI-DSS | Immutable audit trails for financial and payment data | Up to 7 years |
| General Metadata | Invocation metadata, token counts, latency | 90 days |
To meet these standards, use append-only or WORM (Write-Once-Read-Many) storage with cryptographic chaining. This ensures that historical records cannot be altered, a critical safeguard when dealing with auditors.
"A logging pipeline that can silently rewrite old events is not an audit trail; it is a convenience layer." - AI Audit Trails: Logs for Compliance and Forensics
Additionally, integrate legal hold workflows to prevent the deletion of specific records during legal disputes. These workflows automatically block purge jobs until the legal hold is lifted.
Use AI-Powered Monitoring and Anomaly Detection
Once your logs are centralized and secured, you're ready to take monitoring to the next level with AI. AI-powered monitoring turns raw log data into actionable insights, helping you spot patterns and issues that manual reviews simply can't handle at scale. As log volumes grow, human teams can't keep up - but AI can bridge that gap by identifying anomalies in real time.
Establish Baselines for Normal Behavior
Before you can detect anomalies, your system needs a clear picture of what "normal" looks like. This means collecting enough historical data to capture typical usage patterns over time.
- Minimum training data: 3–7 days of data is usually enough to establish a basic baseline.
- Longer-term patterns: For weekly or seasonal cycles, aim for 21–30 days of data.
Be sure to exclude periods of known outages or degraded performance from your training data. If the model learns from these periods, it might normalize poor performance and fail to detect future issues. Additionally, reset anomaly profiles annually or after major system updates. As your architecture evolves, outdated baselines can cause unnecessary noise instead of providing useful signals.
Apply AI and ML Techniques to Log Analysis
Different types of data require different approaches. Here’s a quick guide to choosing the right algorithm for your needs:
| Algorithm Family | Common Techniques | Best Use Case |
|---|---|---|
| Statistical | Z-Score, IQR | Stable metrics without seasonality (e.g., cache hit rates) |
| Time-Series | Prophet, ARIMA | Metrics with strong daily or weekly cycles (e.g., API request rates) |
| Tree-Based | Isolation Forest, RCF | High-velocity streaming data and high-dimensional logs |
| Neural Networks | LSTM Autoencoders | Complex, multivariate signals requiring months of training data |
For workflows involving AI agents, multivariate analysis is especially useful. Instead of monitoring a single metric, it correlates multiple signals - like latency, token usage, and tool success rates - to identify cascading issues. For instance, a spike in token usage might seem harmless on its own, but if paired with rising failure rates and longer step counts, it indicates a larger problem.
"Traditional monitoring asks: 'Is CPU above 80%?' AI anomaly detection asks: 'Is CPU behaving differently than it ever has?'" - Manas Sharma, Dev and Cloud Advocate
AI also significantly reduces alert noise. Studies show that AI-based correlation can cut alert noise by 87% and improve Mean Time to Resolution (MTTR) by 65% through faster root-cause analysis. This means fewer false alarms and quicker problem-solving.
Build Actionable Alerting Systems
Too many alerts can overwhelm teams, leading to critical notifications being ignored. To avoid this, implement a tiered alerting system that prioritizes alerts based on severity and business impact:
| Severity | Response Time | Example Trigger |
|---|---|---|
| P1 (Critical) | Immediate page | PII detected in output, runaway agent costs, system down |
| P2 (High) | 15–60 minutes | Quality SLO breach, distribution shift in step count |
| P3 (Medium) | 24–48 hours | Declining user satisfaction, upward cost trends |
To further reduce noise, focus on repeated anomalies rather than single-point deviations. For example, only trigger a cost alert if the threshold is exceeded for five consecutive runs. This approach eliminates many false positives while maintaining sensitivity to real issues.
Finally, treat alert profiles as dynamic configurations. Schedule regular retraining - typically every 7 days or after major deployments - to ensure detection models reflect current system behavior. An alerting setup that worked six months ago may no longer align with your system today, so keeping it updated is key.
Review and Refine Your Logging Practices Regularly
AI systems don’t stay static. Over time, they can experience data drift (changes in input patterns) or concept drift (shifts in the relationship between inputs and outputs). Without regular maintenance, these systems can gradually degrade without anyone noticing. That’s why it’s crucial to pair a structured logging strategy with consistent reviews.
Set a Regular Review Schedule
To keep your AI in top shape, establish a routine for checking its performance. A quick 5–10 minute daily check can make a big difference. Use this time to scan for errors, review P95 latency, and verify webhook deliveries. These small, proactive steps can save you hours of troubleshooting later.
On a weekly basis, dedicate about 30 minutes to compare error rates over time, analyze token usage patterns, and evaluate the stability of your providers. For more in-depth work, use monthly or quarterly reviews to update dashboards, fine-tune alert thresholds, and revise runbooks to reflect how your system operates today.
"Monitoring is not optional - it is the difference between a reliable product and one that silently breaks." - Field Guide to AI
If you’re working with a team, consider rotating the daily review task among members. This approach not only distributes responsibility but also brings fresh perspectives on what qualifies as "normal."
Test Log Coverage and Detection Accuracy
A review schedule is only as good as the accuracy of your logs. Run synthetic tests in staging environments to ensure your logging pipelines and alerts work properly under failure conditions. Use unique Trace IDs to recreate execution conditions - like the system prompt, context documents, and session history - so you can debug issues locally.
For an added layer of quality control, sample 50–100 outputs per week for manual review. While automated metrics are great for spotting performance dips, human reviewers can catch subtle problems like poor tone, reasoning flaws, or inappropriate wording that automated tools might miss. Include edge cases in your golden datasets to improve future iterations.
Track AI-Specific Quality Metrics
Traditional infrastructure metrics are important, but AI systems require their own set of quality measures. Keep an eye on factors like hallucination rates, task success rates, and user satisfaction, alongside cost and performance metrics.
| Metric Category | What to Track | Example Alert Threshold |
|---|---|---|
| Quality | Hallucination rate, task success rate, user satisfaction | > 10% drop week-over-week |
| Cost | Token usage per request, API spend by feature | > 20% above trailing average |
| Reliability | Tool call success rate, error rate | > 5% error rate |
| Performance | P95/P99 latency, time to first token | > 3x normal P50 value |
Start with broader thresholds - like flagging error rates above 5% - and adjust them as you gain a better understanding of your system’s baseline performance. The ultimate goal is to create a continuous improvement loop: logs help you identify problems, reviews uncover patterns, and those insights lead to better prompts, refined models, and sharper alerts.
Conclusion
The practices discussed above come together to create an effective strategy for AI log analysis. By combining structured logging, centralized management, and AI-driven monitoring, you can gain the visibility needed to troubleshoot issues, improve performance, and secure your AI systems. The key is to continuously refine these practices as your systems evolve.
A survey conducted in Q1 2026 among 420 organizations revealed that 83% of teams running AI agents in production struggle to trace the full sequence of events when an agent fails. This highlights a strategic gap rather than a tooling issue. On the bright side, logging typically adds minimal overhead - less than 5ms per request - making it possible to enhance observability without sacrificing performance.
"Without comprehensive audit trails, incident response becomes guesswork, compliance turns theatrical, and debugging becomes impossible." - AgentNode
If your current setup lacks traceability, compliance, or cost visibility, NAITIVE AI Consulting Agency offers solutions. They specialize in creating robust AI logging architectures, including structured JSON pipelines, automated PII redaction, a multi-layered logging stack, and AI-specific monitoring dashboards. NAITIVE also ensures alignment with compliance standards like SOC 2, GDPR, and HIPAA, helping teams build systems that are both reliable and compliant.
The ultimate goal of AI log analysis is to develop systems that continuously learn and improve - where every failure leads to actionable insights and every review strengthens reliability. This approach ensures your AI systems remain dependable and adaptable in the face of change.
FAQs
How do I choose what AI logs to keep vs. discard?
To determine which AI logs to retain, prioritize structured and easily searchable data that aids in debugging, auditing, and monitoring. Focus on keeping logs that include essential details such as user inputs, system decisions, tool usage, responses, and performance metrics. Remove unnecessary logs and redact any sensitive information to protect privacy. Opt for structured formats like JSON to simplify analysis and help trace the AI agent's decision-making process effectively.
How can I prove what an AI agent did without logging raw prompts?
Structured audit trails offer a practical way to verify an AI agent's actions without keeping raw prompts. These logs record essential details such as tool calls, inputs and outputs, timestamps, and decision points. By concentrating on traceable and decision-focused logs, you can maintain accountability, simplify debugging, and meet compliance requirements - all without the need to store raw prompt data.
What’s the simplest way to connect logs across tools and services?
The easiest way to link logs from different tools and services is by implementing structured logging with correlation IDs and standardized formats. Here’s how you can do it:
- Leverage structured logging libraries: Use these libraries to generate consistent JSON logs, ensuring uniformity across systems.
- Add correlation IDs: Attach unique identifiers to requests so you can trace them seamlessly across multiple systems.
- Include essential metadata: Add details like timestamps and user identifiers to make your logs easier to analyze.
By following these steps, you can make your logs more searchable and interconnected, simplifying troubleshooting and improving analysis efficiency.