
5 AI Disaster Recovery Patterns for Enterprises
Compare five AI disaster-recovery patterns by RTO, RPO, cost, and complexity to match DR posture to workload criticality.

If your AI system fails, bringing servers back is not enough. You need the same model version, feature data, vector index, configs, and routing rules back too - or the system can look healthy and still give wrong answers.
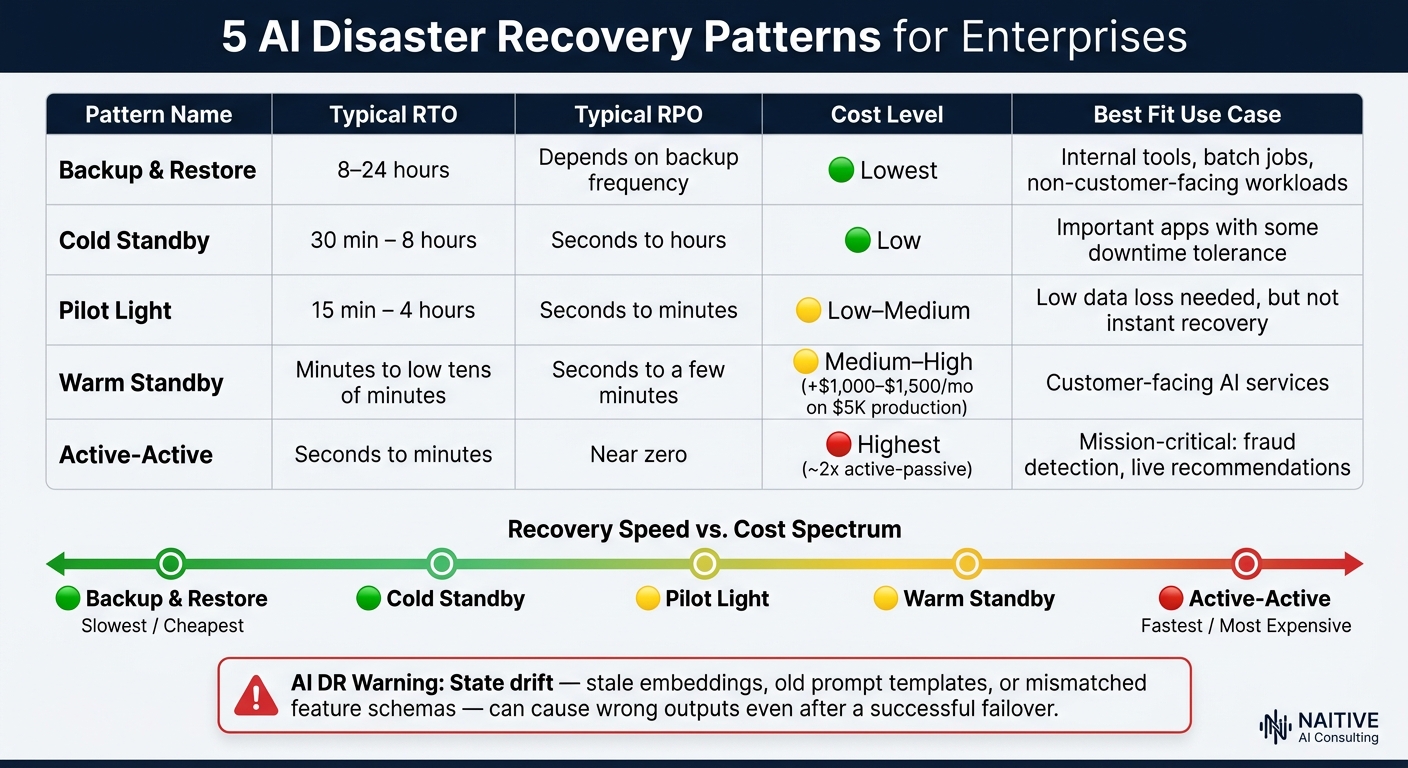
Here’s the short version: I’d group these five DR patterns by recovery time, data loss, cost, and sync difficulty.
- Backup and Restore: lowest cost, but recovery often takes 8 to 24 hours
- Cold Standby: lower-cost second region, with recovery from 30 minutes to several hours
- Pilot Light: core data services stay live, with recovery in 15 minutes to 4 hours
- Warm Standby: live reduced-capacity stack, with recovery in minutes
- Active-Active: multiple regions serve traffic at once, with failover in seconds to minutes
If I were choosing, I’d use:
- Backup and Restore for batch jobs and internal AI tools
- Cold Standby for important apps that can take some downtime
- Pilot Light when I need low data loss without paying for full standby GPUs
- Warm Standby for customer-facing AI that needs low downtime
- Active-Active for the highest-stakes systems, like fraud checks or live recommendations
The main takeaway: the right choice is not just about uptime. It’s about restoring the right AI state in the right order at a cost your team can carry.
5 AI Disaster Recovery Patterns: RTO, RPO, Cost & Complexity Compared
Why AI Stack Recovery Changes Enterprise Resilience
sbb-itb-f123e37
Quick Comparison
| Pattern | Typical RTO | Typical RPO | Cost Level | Sync Difficulty | Best Fit |
|---|---|---|---|---|---|
| Backup and Restore | 8–24 hours | Depends on backup timing | Lowest | Low to medium | Internal, batch, non-customer-facing workloads |
| Cold Standby | 30 minutes to 8 hours | Seconds to hours | Low | Low to medium | Important apps with some downtime tolerance |
| Pilot Light | 15 minutes to 4 hours | Seconds to minutes | Low to medium | Medium | Apps that need low data loss but not instant recovery |
| Warm Standby | Minutes to low tens of minutes | Seconds to a few minutes | Medium to high | High | Customer-facing AI services |
| Active-Active | Seconds to minutes | Near zero to very low | Highest | Highest | Mission-critical, always-on AI services |
A few numbers stand out. Active-active can cost about 2x more than active-passive setups because more than one region runs live inference. And warm standby can add about $1,000 to $1,500 per month if production is around $5,000 per month and the DR region runs at 20% to 30% scale.
I’d also keep one warning front and center: in AI DR, state drift is the hidden problem. A stale embedding index, old prompt template, or mismatched feature schema can do damage even after failover looks done on paper.
So before I pick any pattern, I’d set six inputs up front:
- business impact
- target RTO
- target RPO
- compliance rules
- latency targets like p95 and p99
- standby GPU cost
That gives me a simple way to match the DR pattern to the workload without overbuilding every system.
How to Compare AI Disaster Recovery Patterns
Before you pick a pattern, set six inputs up front: business criticality, RTO, RPO, compliance requirements, inference latency targets, and the cost of standby GPUs or other accelerators. Those six items give you a practical way to compare the patterns below.
The gap between use cases can be huge. Real-time fraud detection has far tighter recovery needs than internal document classification. Fraud systems may need an RTO under 15 minutes and an RPO close to zero, which usually pushes you toward warm standby or active-active. Internal document classification can often handle hours of downtime and some data loss, so backup and restore may be enough.
Latency matters just as much as uptime. A cold restore might hit the RTO target on paper but still miss the mark for sub-second apps like recommendation engines, AI copilots, and call-center assistants. The key test is simple: can the secondary setup deliver acceptable p95 and p99 latency, or can it only return responses after users have already felt the delay?
Cost usually comes down to idle GPU or accelerator capacity. Active-active runs inference compute across more than one site, so infrastructure spend is often about 2x compared with active-passive. Pilot light trims cost by keeping only a small footprint ready, but that tradeoff shows up in longer scale-up time and a slower RTO. So yes, cost matters. But recovery speed also depends on how much system state you need to rebuild or sync.
For AI, disaster recovery is a system-of-systems issue. You’re not just bringing back one app. You need to restore the model registry, deployment manifests, training data, feature stores, vector databases, and inference services in the right order and at the right version. For teams in regulated settings, region controls, audit logs, and tested failover paths may also be required.
Use these filters to compare the five patterns below.
1. Backup and Restore
Backup and Restore is the lowest-cost disaster recovery pattern, often recommended by AI consulting experts for non-critical systems. You back up the AI assets that matter to durable storage, then rebuild the stack after a failure. There’s no secondary environment sitting in the background waiting to take over. It’s the default choice when cost matters more than recovery speed.
This pattern fits non-customer-facing workloads, such as internal analytics, batch scoring, or weekly forecasting.
RTO
Expect 8 to 24 hours to recover an AI stack with this pattern. That time usually covers:
- provisioning infrastructure
- restoring databases and feature stores
- redeploying inference services
- running validation tests before traffic goes live
Automation can trim that timeline, but recovery is still much slower than setups with always-on secondary infrastructure.
RPO
RPO matches your backup frequency. Put simply, the more often you back up, the less data you stand to lose. Nightly snapshots can mean losing up to a day of work. Continuous backups can cut that loss to minutes.
Infrastructure cost
You pay only for backup storage until you need recovery or run a DR drill. That makes this the lowest-cost option.
State replication complexity
Replication complexity is low to moderate. The big risk is missing part of the system. In AI stacks, it’s not enough to save raw data alone. You also need backups for model metadata, feature definitions, transformation logic, routing rules, manifests, and secrets.
Azure Machine Learning is a good example. It does not provide automatic failover or disaster recovery for workspace metadata like run history, models, and environments. So teams have to build that backup coverage on their own.
If that recovery window feels too long, the next pattern keeps a small environment ready to scale.
2. Active-Passive Cold Standby
Cold standby sits in the middle ground between low-cost backup recovery and faster failover. You run production in one region, while a mostly idle DR region waits in the background. If something breaks, IaC templates rebuild the main stack, restore data, and point traffic to the standby side. This setup fits important workloads that matter a lot, but can still live with a few hours of downtime.
RTO
RTO is usually 30 minutes to several hours, and it can stretch to 4–8 hours for complex multi-model systems. The range comes down to things like automation, DNS changes, security approvals, and GPU quota limits.
RPO
RPO can range from seconds to hours, depending on how often data is replicated. Continuous or near-continuous replication can keep data loss down to minutes. Nightly snapshots, on the other hand, can push that window closer to hours.
Infrastructure cost
Cold standby is the lowest-cost multi-region pattern because secondary GPUs and compute resources stay idle until failover. In practice, you're mostly paying for replicated storage, light networking, and IaC pipeline tooling. That can trim monthly DR costs by 50% to 80% compared with keeping warm GPU pools running in a second region.
State replication complexity
Complexity is low to moderate. Binaries and configs usually replicate without much trouble. Feature stores need schema alignment, and streaming pipelines tend to be the trickiest part.
Pilot light cuts cost even more by keeping only the smallest recovery core running.
3. Pilot Light
Pilot light sits between cold standby and warm standby.
The idea is simple: keep the core state running in the secondary region, but leave the heavy compute off until you need it. That usually means databases, feature stores, model registries, API gateways, and orchestration stay live. At the same time, GPU inference, batch jobs, and heavy feature pipelines stay offline until failover.
If disaster hits, the team spins up those dormant compute resources around the always-on data layer using IaC automation during failover.
RTO
Pilot light usually delivers an RTO in the tens of minutes to a few hours.
In highly automated setups, services can come back in about 15 to 60 minutes. Less critical batch AI workloads may live with 2 to 4 hours. In plain English, the clock mostly comes down to how fast you can scale up, how much of the process is automated, and how long dependent systems take to resync.
RPO
Because core data services replicate continuously, RPO usually stays in the seconds-to-minutes range. In some setups, synchronous replication pushes that to effectively zero minutes.
Infrastructure cost
Pilot light usually costs about 10% to 15% of production spend.
Most of that spend comes from always-on replicas, cross-region storage, and minimal networking, not from idle GPU capacity. That’s why pilot light costs more than backup-and-restore, but far less than warm standby.
State replication complexity
The complexity here is moderate.
You need to keep critical state in sync all the time: feature data, model versions, live config, and streaming offsets. Then, during failover, you rebuild caches and batch analytics on demand.
Warm standby uses the same replicated core, but it also keeps compute running all the time. That cuts failover time even more, though you pay more for it.
4. Active-Passive Warm Standby
Compared with pilot light, warm standby keeps the same replicated state and keeps compute online. The big difference is simple: the secondary environment is already deployed and running, just at a lower scale, so it can take traffic if the primary region goes down.
That stack usually includes model-serving APIs, inference containers, feature stores, vector databases, and monitoring. Those are the parts that make failover possible without doing a full rebuild first. In many setups, the secondary site runs at about 20–50% of production capacity. When failover starts, the team scales up what already exists instead of spinning up everything from scratch.
RTO
Always-on compute is what trims failover time. Since the secondary environment is already live, recovery is mostly about promoting services, updating DNS or load balancer routing, and scaling compute upward. In practice, warm standby RTO is often measured in minutes to the low tens of minutes, depending on how much of the runbook is automated and how much traffic still needs to be shifted.
For customer-facing AI workloads, that’s a clear step up from pilot light. You’re not starting cold. You’re flipping over to a live system and turning the dial up.
RPO
Warm standby works well with continuous or near-real-time replication, which keeps RPO low - often seconds to a few minutes. For AI systems, that replication has to cover more than the main app database.
It usually needs to include:
- Model artifacts
- Feature store updates
- Vector indexes
- Streaming data
Miss one of those pieces, and failover can look fine on paper while outputs drift in practice.
Infrastructure cost
Warm standby costs more because the secondary environment runs 24/7. There’s no way around that. Even at lower scale, an always-on DR region adds a meaningful bill.
If production runs at $5,000 per month, a warm standby setup at 20–30% scale adds about $1,000–$1,500 per month in DR-region infrastructure.
State replication complexity
State replication is usually the hardest part of warm standby for AI teams. Stateless services are the easy part. The pain shows up in stateful AI pipelines: model weights, fine-tuning artifacts, feature stores, vector indexes, caches, user session context, and conversation memory all need careful handling to stay in sync across regions.
The standby site has to mirror data, model versions, and configuration so inference behavior stays aligned after failover. If that sounds picky, it is. A stack can look healthy and still return bad outputs because embeddings are stale or prompt templates are out of date.
Regular DR drills matter here. AI failures often show up as stale embeddings or old prompt templates even when the infrastructure itself looks fine. That’s the trade-off with warm standby: faster failover, but stricter state control.
5. Active-Active
Warm standby gives you a live backup region. Active-active takes that idea a step further by serving traffic from multiple regions at the same time.
In an active-active setup, two or more regions handle live traffic at once. If one region goes down, traffic moves to the healthy regions automatically. That makes this pattern a strong fit for customer-facing AI services that can't afford downtime, like chatbots, fraud detection, and real-time recommendations. It offers the fastest recovery on this list, but the tradeoff is plain: you need the budget and the replication setup to support it.
RTO
Because traffic is already spread across regions, there isn't a standby environment waiting to be promoted. In a well-designed active-active setup, RTO can be near zero, often measured in seconds or minutes, depending on health checks and routing behavior.
That said, fast failover only works if the remaining regions can take the extra load. If they can't, recovery still happens, but users may see a degraded service instead of a smooth handoff.
RPO
RPO can be very low and may get close to near-zero because writes are continuously replicated or coordinated across regions.
Here's where AI systems get tricky. They usually have several layers of state, and those layers don't always replicate at the same pace. Model weights, feature-store records, session state, and event logs may each move on different schedules. So in practice, your effective RPO is set by the slowest-consistent data layer.
Infrastructure cost
Active-active is the most expensive pattern on this list.
Every region runs at production-grade capacity all the time. That means you're paying for duplicate compute, replicated storage, networking, observability, and often extra headroom too. Some teams fully size each region for failover. That's safer, but it pushes costs even higher.
State replication complexity
This is the hard part for AI teams. Routing traffic is the easy piece. The tougher job is making sure each region reads and serves the same state in the same way - the same model version, prompts, and feature schema.
Once writes can happen in more than one region, things get messy fast. You can run into write conflicts, replication lag, and cases where different users get different model versions. A common way to reduce that risk is to keep inference active in every region, while centralizing writes for canonical records and using idempotent APIs with clear conflict rules.
Next, compare active-active with active-passive to see when the added resilience is worth the cost.
Warm Standby vs. Pilot Light: Side-by-Side Comparison
The choice comes down to one thing: how much recovery capacity is already running before an outage.
Pilot light keeps only the recovery core online - databases, configuration stores, and replication services. Warm standby goes further. It keeps a scaled-down but fully live copy of your workload running in the secondary region. That setup can take traffic right away and then scale up after failover. For AI systems with live models, feature stores, and vector indexes, that gap is a big deal. If those pieces need to come back in sync, the amount of live capacity you keep ready can make or break recovery. Both patterns still depend on synchronized model artifacts, feature data, and vector indexes.
| Dimension | Pilot Light | Warm Standby |
|---|---|---|
| Cost | Lower steady-state spend; GPU costs rise mainly during failover | Higher ongoing spend; a reduced-capacity environment runs continuously |
| RTO | Tens of minutes; requires provisioning and scaling during failover | Minutes; the environment is already live and can absorb traffic right away |
| RPO | Minutes; depends on backup cadence and replication intervals | Seconds; data is continuously replicated and available for failover |
| Readiness | Partial readiness; core infrastructure is present, but AI serving and inference tiers aren't running | High readiness; the workload is already running at reduced capacity |
| Infrastructure footprint | Minimal; databases, object storage, and replication services only | Moderate; duplicated business-critical systems plus a scaled-down serving fleet |
| Pre-provisioned AI serving capacity | None or minimal; inference servers and model endpoints are launched during recovery | Yes; reduced-capacity GPU endpoints are already online and monitored |
For customer-facing AI workloads - fraud detection, real-time recommendations, or LLM-powered APIs - warm standby often earns its higher price tag. Why? Because waiting tens of minutes during an outage can be painful when users expect instant responses.
For internal analytics, batch scoring, or back-office automation, pilot light is often the better trade-off. It keeps the footprint smaller and cuts steady-state spend, which makes sense when longer recovery windows are acceptable.
Provisioning automation also shapes the decision. Pilot light leans hard on reliable infrastructure-as-code and scripted deployment pipelines, since most capacity gets created during the incident itself. Warm standby puts the focus somewhere else: continuous testing. Regular failover drills and cross-region health checks on a fixed schedule help prove that the standby setup is actually ready when you need it.
Active-Active vs. Active-Passive: Key Trade-Offs
This section looks at the two far ends of the DR spectrum: active-active, where every region serves live traffic, and active-passive, where one region stays on standby.
In an active-active setup, two regions run at the same time and both handle live traffic. If one region goes down, traffic moves to the healthy region with little interruption, often in seconds to minutes. In an active-passive setup, only the primary region handles traffic. The secondary waits on standby until failover, so recovery takes longer because it must be promoted and traffic must be rerouted before service comes back.
Cost is one of the biggest differences. Active-active costs more because both regions need production-capacity GPU fleets. Active-passive is cheaper because standby capacity can stay reduced or even idle.
There’s also a big difference in write complexity. When both regions can write at the same time to model registries, feature stores, vector indexes, or experiment tracking systems, things get messy fast. You have to deal with replication lag, conflict resolution, and split-brain risk. Active-passive sidesteps most of that because writes stay centered in the primary region.
The table below isolates the differences that matter most for AI workloads.
| Dimension | Active-Active | Active-Passive |
|---|---|---|
| Availability | Highest; both regions serve traffic simultaneously | High, but one region is idle or scaled down until failover |
| Failover behavior | Traffic shifts away from the failed region; disruption is usually seconds to minutes | Standby must be promoted and traffic rerouted; recovery is slower |
| Traffic management | Requires load balancing, geo-routing, and health checks across regions | Simpler routing because only the primary region serves traffic during normal operation |
| Data consistency | Harder; concurrent writes can create replication lag and conflict handling requirements | Easier; the primary-writer pattern reduces split-brain risk |
| State write complexity | Higher; concurrent writes, replication lag, and reconciliation must be managed | Lower; writes stay centralized in the active region |
| Total cost | Highest; production GPU capacity must be duplicated across regions | Lower; standby GPU capacity can be reduced or provisioned on demand |
These trade-offs shape the implementation choices in the next section.
Implementation Notes for Enterprise AI Teams
After you compare RTO, RPO, and cost, the next step is execution. Picking a DR pattern is just the beginning. During failover, the stack needs to come back cleanly and work the way you expect.
Infrastructure as Code (IaC) sits at the center of that effort. Tools like Terraform, AWS CloudFormation, and Azure Bicep let teams define GPU clusters, networking, model-serving endpoints, feature stores, and vector databases as version-controlled code. If a region goes down, you can rebuild the same environment in a consistent way instead of piecing it together by hand. Pair IaC with automated CI/CD pipelines that rebuild AI infrastructure with little manual effort, and hitting your RTO goals starts to look far more realistic.
Replicated storage also needs a clear plan by data type. Not all AI data should be copied the same way. A simple mapping helps:
- Asynchronous replication for model binaries
- Near-synchronous replication for feature stores and vector indexes
- Replicated state stores for agent memory and workflow state
Replication alone doesn't mean much if you can't prove the secondary setup will work in a failover. Observability needs to track signals that show DR readiness. That includes guardrail trigger rates, agent task completion rates, and replication lag across regions. Synthetic tests should run realistic multi-step agent workflows against DR endpoints to confirm the DR setup is functional, not just powered on. Alerts matter here too. Stale snapshots, failed backups, and unhealthy standby clusters should page on-call engineers before a disaster hits, not while the team is already in the middle of one.
Govern model versions and snapshots tightly. A centralized model registry with clear promotion stages - staging, production, and DR-ready - helps make sure only validated models are deployed during failover. And the risk here isn't small. Stale models, prompt templates, or configs can return wrong answers even when the infrastructure looks fine. Snapshots should carry tags for dataset versions, encryption policies, and any compliance constraints tied to them, especially in regulated industries. Configuration files, routing rules, prompt templates, and agent policies should live in version-controlled repositories with change-approval workflows. Otherwise, DR setups can drift away from production without anyone noticing.
Once version control and snapshot rules are in place, put that policy into a runbook. Runbooks and drills turn a good design into something teams can depend on. A runbook should spell out preconditions, roles, duration, commands, and validation steps, like running a synthetic inference test and checking that latency stays under 500 ms. Regular failover drills should simulate AI-specific failure modes, including vector DB outages, degraded GPU capacity, and model registry failure. That's where hidden gaps tend to show up. After each drill, measure actual RTO and RPO against your targets and update the runbook based on what happened.
Conclusion
No single DR pattern works for every AI workload. The right choice comes down to three things: how critical the workload is, how much downtime and data loss the business can absorb, and how much cost and complexity the team can handle. Put simply, these patterns mainly differ in how much recovery capacity stays live before an outage. The five options sit on a spectrum: backup and restore for low-priority workloads, cold standby for lower-cost regional recovery, pilot light for faster failover with minimal always-on capacity, warm standby for recovery in minutes, and active-active for near-zero RTO and RPO.
A mistake many enterprises make is using the same DR posture for every AI system. That usually backfires. Mission-critical AI workloads and lower-priority batch jobs shouldn't use the same DR setup. A better approach is to group AI workloads by business impact, map each one to the right pattern, and review those choices as usage grows and revenue exposure changes.
That kind of classification only holds up if it's backed by tested runbooks and failover drills. NAITIVE AI Consulting Agency can help enterprises classify AI workloads and map them to the right DR tier.
The goal isn't maximum resilience at all costs. It's the right level of resilience for each workload, backed by tested runbooks and failover drills.
FAQs
How do I choose the right AI DR pattern?
Choose the right disaster recovery pattern by matching it to your business goals, workload criticality, and infrastructure limits.
Review:
- infrastructure compatibility, cost, and regulatory needs
- cloud, on-premises, or hybrid workload patterns
- RTOs and RPOs by environment criticality
- automated failover and health monitoring
What AI state must be restored after failover?
After failover, bring services back to a verified, stable model state so the system returns to normal operation in a secure and consistent way.
Make sure database replication and backups are in sync too. That helps protect user data and conversation history, with no gaps or drift between systems.
Then bring traffic back in stages instead of all at once. This gives your team time to watch performance, check for issues, and confirm the system is stable before moving back to full capacity.
How often should we run AI disaster recovery drills?
Run disaster recovery drills on a regular basis to make sure your backup plans work the way they’re supposed to and that your systems can bounce back after a disruption.
How often you test depends on how critical the system is and the level of risk around it. In many enterprise AI teams, that means setting up regular drills and reviewing risks every quarter or every six months as systems change over time.