AI Consulting ROI: Case Studies and Insights
Narrow, measured AI projects (invoices, support, decision tools) deliver verifiable ROI, usually paying back in 6–12 months.

Most AI consulting projects do not earn trust with big claims. They earn it with clean math. From the cases in this article, the pattern is simple: projects with a tight scope, a signed-off baseline, and full cost tracking tend to pay back in about 6 to 12 months.
If I strip the article down to the part that matters most, here’s the answer:
- ROI comes from measured process change, not vague AI impact
- The best early targets are narrow workflows like invoices, support tickets, and analyst review work
- Hard savings and freed-up capacity should stay separate
- 30, 90, 180, and 365-day check-ins help show whether gains last
- Costs after launch - support, training, monitoring, and internal time - can change the math a lot
Here’s the short version of the three case-study patterns:
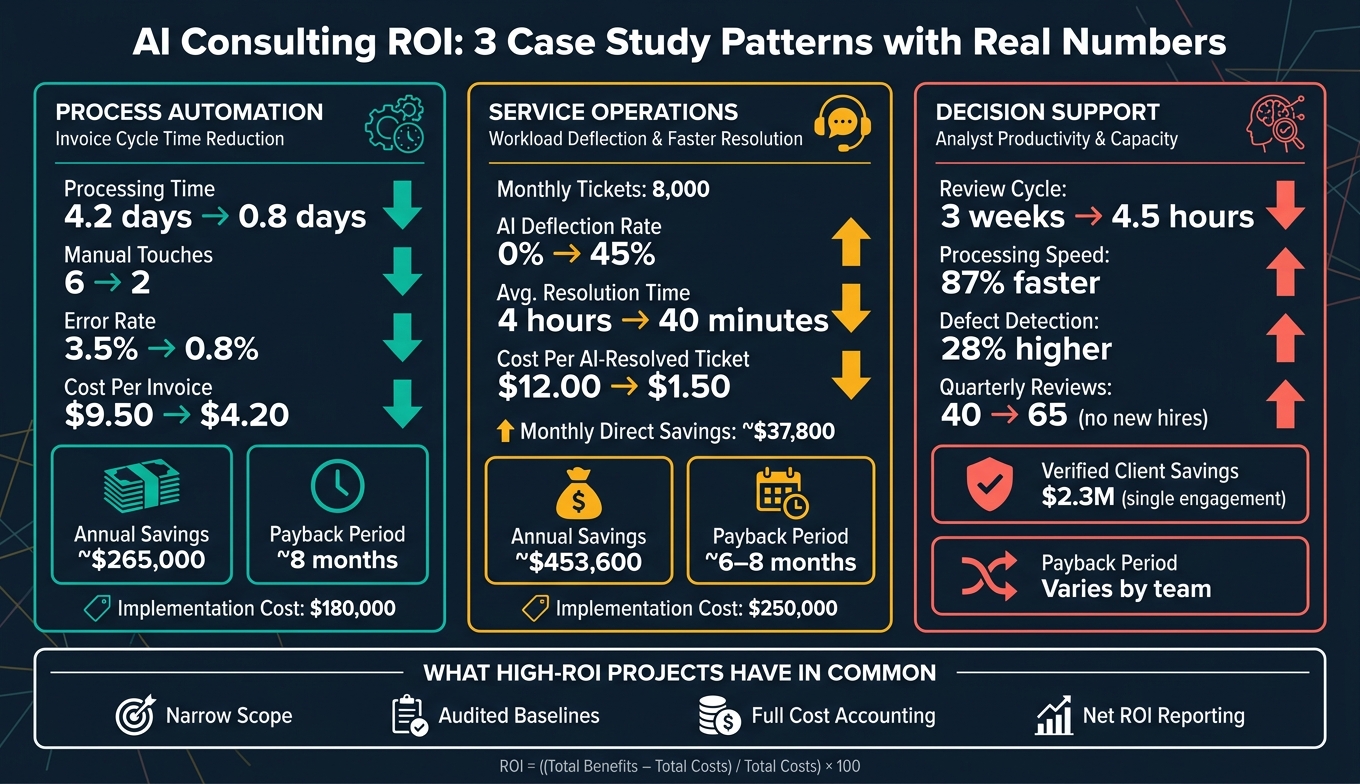
- Invoice automation: cost per invoice fell from $9.50 to $4.20, with about $265,000 in annual savings and about 8 months to payback
- Support deflection: a team handling 8,000 tickets per month used AI to deflect 45% of Tier-1 volume, saving about $453,600 per year, with about 6 to 8 months to payback
- Decision support: AI helped analysts finish more reviews without adding staff, with one published case showing $2.3 million in verified client savings
10 Best AI Business Use Cases & How AI Delivers ROI
sbb-itb-f123e37
Quick Comparison
| Pattern | Main KPI | Main result | Cost impact | Payback |
|---|---|---|---|---|
| Invoice automation | Cycle time, error rate, cost per invoice | 4.2 days → 0.8 days | About $265,000/year saved | About 8 months |
| Support deflection | Deflection rate, resolution time, cost per ticket | 45% of tickets handled by AI | About $453,600/year saved | About 6–8 months |
| Decision support | Throughput, turnaround time, team capacity | More reviews without new hires | Avoided hiring + more output | Varies by team |
What I like about this article is its narrow lens: it looks at workflows, dollars, and timing. No brand impact. No guessed future revenue. Just a simple test: did the project return more than it cost?
That’s the frame for the rest of the article.
What AI Consulting ROI Means in Operational Efficiency
In AI consulting for operational efficiency, ROI tells you a simple thing: did the project return more value than it cost to build, launch, and run? The formula is straightforward: ROI = ((Total Benefits − Total Costs) / Total Costs) × 100.
On the benefit side, that usually means labor savings, fewer errors, shorter cycle times, more throughput, and costs the business no longer has to absorb. To make those gains measurable, teams convert them into dollar amounts using fully loaded labor rates and volume assumptions. That’s the lens used in the case studies that follow, so the numbers point to actual gains instead of inflated claims.
Core ROI Formula and Net-Benefit View
Most ROI mistakes don’t come from bad math. They come from missing costs.
A complete cost stack should include upfront design and implementation, integration work and data preparation, licensing and infrastructure, plus the costs that stay with you after launch: monitoring, support, training, and internal labor. Those recurring support and operations costs are easy to miss, but they keep showing up month after month and can change both payback period and net ROI in a big way.
That’s why the net-benefit view matters more than gross savings. Say an automation project removes 5,000 hours of manual work each year. That sounds strong on paper. But gross savings can paint the wrong picture if you don’t account for operating costs or ask a basic question: do those saved hours cut spending, or do they just free up staff capacity for other work?
A finance automation survey reported first-year ROI of 30% to 300%, with a 150% median. That difference between gross savings and net return is what gives case-study ROI weight.
Operational KPIs That Prove Value
Operational ROI shows up through a steady KPI set. These seven KPIs link process gains to financial results across process automation, service operations, and decision support - the three patterns covered in the next section.
| KPI | What It Measures | Business Value It Demonstrates |
|---|---|---|
| Cycle time reduction | Average time to complete a process, start to finish | Faster throughput and quicker revenue realization |
| Automation rate | % of tasks completed by AI with little or no human intervention | Lower labor demand and reduced process variability |
| Throughput | Volume of work processed within a set timeframe | Ability to scale without adding headcount |
| Labor hours saved | Total hours reclaimed through automation | Capacity gains, avoided hiring, payroll reduction |
| Error reduction | Change in defect, rework, or exception rate | Fewer rework costs and lower compliance risk |
| Service response time | Speed at which requests or inquiries are resolved | Better customer retention and SLA performance |
| Cost per case/transaction | Total operational cost divided by units processed | Improved unit economics and scalable financial performance |
The case studies below use these KPIs to link baseline performance with post-deployment ROI. From there, the next section walks through how ROI gets calculated and assigned in actual consulting projects.
How ROI Is Measured in AI Consulting Case Studies
AI ROI only means something if the math is clean. That starts with a solid baseline, full cost accounting, clear attribution, and a phased view of when gains show up. From there, the job is simple in theory and tricky in practice: turn process change into dollar value.
Baseline Documentation and Value-Per-Unit Assignment
Before any AI solution goes live, document how the process works right now using source-system data, not memory or team estimates. In plain English, that means pulling:
- staffing effort in FTEs by role
- average handling time (AHT) per transaction from system logs
- error and rework rates from quality control data
- queue volume and backlog from consistent time snapshots
- current software and outsourcing spend
Use at least 90 days of pre-deployment data for the exact KPIs the project is trying to move. That helps account for normal variance and seasonality. In many AI consulting engagements, teams won’t approve an ROI claim until that 90-day baseline window is in place and both operations and finance have signed off.
Once the baseline is locked, each gain needs a clear dollar value tied to a documented assumption. The usual starting point is fully loaded labor cost per hour: base salary, benefits, payroll taxes, and overhead.
Here’s what that looks like. If an agent earns $52,000 per year and benefits plus overhead add 30%, the fully loaded cost comes to about $67,600 per year, or about $32.50 per hour based on 2,080 working hours. Save 3,000 hours per year, and the labor value is $97,500.
The same logic applies to outsourced work. If a BPO provider charges $3.25 per invoice and AI cuts volume by 40,000 invoices per year, the avoided cost is $130,000 per year.
There’s an important line here:
Hard savings reduce spend - reduced outsourcing, eliminated overtime, dropped licenses. Soft savings increase capacity - time freed up and redeployed.
Keep those two buckets separate. And don’t count the same saved hour twice.
Once the baseline is in place, the next step is proving AI caused the change.
Attribution, Sensitivity Analysis, and Measurement Windows
The strongest way to show attribution is a before-and-after comparison with a control group. That means comparing an AI-enabled team with a similar team or workflow that did not get the AI change during the same period.
Say the AI team cuts AHT from 10.2 minutes to 6.1 minutes, a 40% reduction, while the control team moves from 10.4 minutes to 9.7 minutes, or about 7%. The gap works out to about 33 points of attributable improvement. That’s a much cleaner story than just saying, “AHT went down.”
If a control group isn’t possible, teams usually fall back on segmented time-series analysis against past seasonal patterns. Another route is direct usage tracking: log the share of transactions the AI handled fully versus the share it only assisted with, then multiply those usage rates by the measured gain per transaction. It’s not magic. It’s bookkeeping with discipline.
Sensitivity analysis keeps a case study from leaning on one rosy number. The usual setup is three scenarios:
- Conservative
- Expected
- High-case
Those scenarios change the main assumptions, such as adoption rate, AHT reduction, and how much saved time turns into actual dollar savings.
A conservative case might use a 20% AHT reduction, 60% AI adoption, and assume only 50% of saved time gets monetized. That would produce about $120,000 in annual benefit, with 45% ROI and an 18-month payback. The expected case, using midpoint assumptions, might reach $220,000 in annual benefit and 95% ROI with a 10- to 12-month payback. The high case, backed by top-quartile pilot data, could reach $360,000 and 150% ROI.
The smart move is to lead with the conservative case and treat the high case as upside, not the headline.
Timing matters too. Results should be reported at 30, 90, 180, and 365 days so readers can see when the value starts to show up. In the first 30 days, implementation and training costs often outweigh gains. By 90 days, adoption tends to settle down, and rolling averages give a better read on whether 12-month targets are within reach. Around 180 days, cumulative gains often get close to breakeven. The 12-month view is where annualized ROI can usually be reported with confidence.
That measurement setup is the frame used in the case studies that follow.
3 AI Consulting Case-Study Patterns That Show Measurable ROI
AI Consulting ROI: 3 Case Study Patterns with Real Numbers
A framework only matters if it changes day-to-day work in a way you can measure. These three patterns tie straight to the KPIs above: cycle time, deflection, labor hours saved, and cost per transaction.
Process Automation: Cycle Time Reduction in Document and Transaction Workflows
Take a U.S.-based manufacturing firm that processes 50,000 invoices per year. Before any AI work began, the accounts payable team averaged 4.2 days per invoice, needed 6 manual touches per transaction, had a 3.5% error rate, and spent about $9.50 per invoice in fully loaded labor and overhead. That put annual baseline cost at about $475,000, tracked through cycle time, error rate, and cost per invoice.
The engagement moved in three phases: discovery in about 4 to 6 weeks, pilot in 8 to 12 weeks, and rollout in another 8 to 12 weeks.
Published benchmarks show a clear pattern. Organizations that reach 80% or more fully automated processing often post 3-year ROI above 300%. Even teams in the 60% to 70% range still tend to see a 2x to 3x return over three years.
| Metric | Baseline (Pre-AI) | Post-Launch (AI Automation) |
|---|---|---|
| Avg. processing time per invoice | 4.2 days | 0.8 days |
| Manual touches per invoice | 6 | 2 |
| Error rate | 3.5% | 0.8% |
| Cost per invoice | $9.50 | $4.20 |
| Annual direct savings | - | ~$265,000 |
| Implementation cost (one-time) | - | $180,000 |
| Payback period | - | ~8 months |
The payback math is simple: $180,000 ÷ $265,000 annual savings ≈ 8 months. That lines up with published invoice automation benchmarks.
The same logic works in service operations too. The only difference is that AI is cutting demand, not just document handling.
Service Operations: Workload Deflection and Faster Resolution
Now look at a representative U.S. support team handling 8,000 tickets per month across email, chat, and phone. This is a clean service-operations model because the ROI shows up in deflection rate, response time, and cost per ticket. At a fully loaded cost of $12.00 per ticket, annual support spend comes to about $1.15 million before automation.
After adding AI triage, intent-based routing, and autonomous chat and voice agents, published benchmarks show a median Tier-1 deflection rate of 41.2%, with the top quartile hitting 58.7%. So a 45% deflection rate is a fair target for well-structured intents.
In plain terms, that means 3,600 tickets per month get fully resolved by AI at about $1.50 each instead of $12.00. Monthly direct savings land at about $37,800, or roughly $453,600 per year.
| Metric | Baseline (Pre-AI) | Post-Launch (AI Automation) |
|---|---|---|
| Monthly ticket volume | 8,000 | 8,000 |
| AI deflection rate | 0% | 45% |
| Avg. resolution time | 4 hours | 40 minutes |
| Cost per AI-resolved ticket | - | $1.50 |
| Monthly direct savings | - | ~$37,800 |
| Implementation cost (one-time) | - | $250,000 |
| Payback period | - | ~6–8 months |
One e-commerce deployment reported 68% Tier-1 ticket deflection and first-contact resolution moving from 31% to 68% after launching an AI customer service agent.
When the goal is less about handling volume and more about improving judgment, the ROI shifts again.
Decision Support: Analyst Productivity and Higher-Value Capacity
In decision support, the story is less about transaction cost and more about getting more done without adding headcount. The main KPIs here are throughput, turnaround time, and analyst capacity.
A published AI deployment in spend review consulting cut a review cycle from 3 weeks to 4.5 hours, found 23% to 28% more savings opportunities, and delivered $2.3 million in verified client savings in a single engagement. The same case showed 87% faster processing and 28% higher defect detection.
Productivity research points in the same direction. Microsoft Copilot users were 29% faster across search, writing, and summarizing tasks, saving 14 minutes per day.
Put that into team terms and the picture gets pretty clear. If a team of 10 analysts used to complete 40 major reviews per quarter, and AI decision support lifts output to 65 reviews without more hiring, the avoided cost of adding 3 to 4 more analysts becomes a major source of annual savings even before you count the extra value created by higher throughput.
Key Insights from the Case Studies and Conclusion
What High-ROI AI Consulting Projects Have in Common
Put the case studies side by side, and the same playbook shows up again and again.
High-ROI projects shared four traits: narrow scope, audited baselines, full cost accounting, and net ROI reporting. Whether the work focused on invoice automation, service ticket deflection, or analyst decision support, the projects with documented returns all started small: one workflow, one owner, one metric. And the upside wasn’t reported as a vague win. It was measured as net ROI after fees, integration, and operating costs.
That helps explain why tighter operational workflows tend to show ROI sooner. Bounded workflows are easier to measure because the unit economics are plain to see. You can track input, output, labor time, and cost without getting lost in a giant company-wide program. That’s a big reason broad transformation efforts often take longer to prove their case.
The data backs that up. A Deloitte survey found that only 15% of organizations already see significant, measurable ROI from generative AI, while 38% expect it within one year. In one example, a global bank cut document processing time from 30 minutes to 30 seconds and dropped cost per document from about $5.00 to under $0.10.
The common thread here isn’t just model performance. It’s operating discipline. The strongest projects had executive sponsors tied to P&L results and frontline managers involved in workflow design from day one. That mix matters. Leaders keep the work tied to dollars, while operators make sure the system fits how the job gets done.
Projects that begin with discrete automation in call handling or back-office workflows usually reach ROI faster than enterprise-wide launches. It’s the difference between fixing one leaky pipe and trying to rebuild the whole house at once.
Conclusion: How to Assess the Next AI Consulting Opportunity
A simple screen works well here: measurable workflow, monetizable benefit, verifiable result. If all three boxes are checked, the project is worth scoping. If one is fuzzy, sort that out before you spend budget.
In practice, that means documenting 3 to 6 months of baseline data on volume, cycle time, and fully loaded labor cost. Then run a pilot before a full rollout. Compare results against a control group when possible, and scale only after the first deployment shows stable performance and measurable savings.
That order matters. Baseline first, pilot second, scale last. It keeps the team grounded in numbers instead of hope and gives decision-makers a clean way to judge whether the project is paying off.
FAQs
What counts as hard savings vs. freed-up capacity?
Hard savings are direct cuts in operating costs that you can tie to the work itself. That can mean a lower cost per interaction, less annual contact-center spend, fewer maintenance costs, or removing paid manual after-call work and rework.
Freed-up capacity is measurable time or output gained when AI cuts cycle time or manual effort. In practice, that might look like recovered agent hours, annual hours saved, or more work getting done without adding headcount.
How much baseline data do I need before measuring AI ROI?
Use 12 months of past data before deployment to set a clear baseline. That gives you a solid picture of current operations and makes the before-and-after comparison much more dependable.
Track metrics like manual processing time, operating costs, error rates, and customer satisfaction. NAITIVE AI Consulting Agency can help define and document these metrics, so your ROI is measured on a firm data base.
Which workflow should I automate first to see faster ROI?
Start with a high-volume, repetitive, rule-based workflow. The best picks are usually the ones that cut manual work and reduce errors, like invoice processing or tier-1 CRM tasks such as appointment scheduling, order tracking, and password resets.
These use cases often pay back within months - about 60–90 days for CRM or back-office automation - because they’re easier to standardize and measure at scale.