
AI agents for water utilities: 7 use cases
Seven AI-agent workflows for water utilities: leak detection, demand forecasting, pressure and pump control, maintenance, customer service, and compliance.

AI agents help water utilities spot problems, plan work, and prepare reports - while operators stay in control. The best starting point is one narrow task, such as ranking suspected leaks, with results checked against the current process before any expansion.
The seven use cases cover:
- Leak detection and burst-risk assessment: Flag suspected leaks and rank pipes for field checks.
- Meter analysis and demand forecasting: Find unusual readings and estimate water demand.
- Pressure control: Test proposed changes against pressure and fire-flow limits.
- Pump scheduling and energy use: Plan pumping around demand, electricity rates, and storage needs.
- Predictive maintenance and crew routing: Rank repairs and plan routes based on asset condition, skills, and safety rules.
- Customer service and urgent reports: Handle routine requests and send emergencies to staff.
- Compliance reporting and water-quality review: Check records, flag gaps, and draft reports for review.
The stakes include cost: EPA reports that water and wastewater systems can account for 30%–40% of a municipality’s total energy use. But savings alone aren’t enough. Each workflow needs checked data, secure connections, clear permissions, audit logs, and human approval for actions that could affect safety or service.
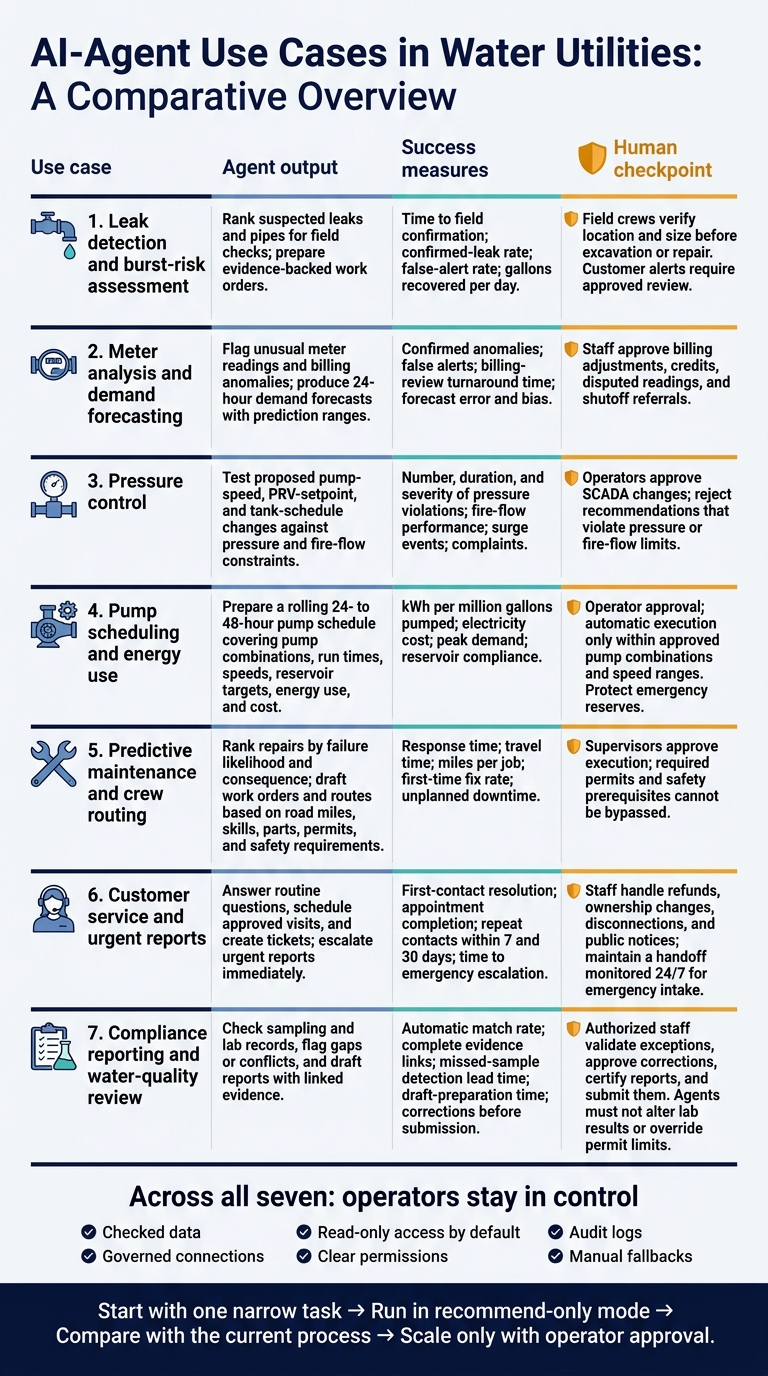
7 AI Agent Use Cases for Water Utilities
Water-AI Nexus - From Digital Twins to AI Agents: What Water Utilities are Implementing Now
sbb-itb-f123e37
How AI Agents Work in City Water Systems
A predictive model flags a risk. An agent checks the signal, gathers evidence, ranks urgency, recommends a response, and opens a review task.
The agent should read system data through governed connections, preferably with read-only access. Record the timestamp, asset ID, location, unit, and data quality. Missing or conflicting readings should prompt verification - not action.
SCADA remains responsible for real-time monitoring and control. In distribution operations, the agent stays in advisory mode, while operators retain control. Hydraulic models can test how a proposed response would affect pressure zones, flow, storage, and fire-flow conditions across the distribution network. The agent can request a model run and explain its results. A digital twin can validate sensor signals before an incident is escalated.
Under approved automation rules, the agent can draft low-risk inspection tickets. Recommendations belong in the work-management system, not the PLC. Log the trigger, data timestamps, model or rule version, uncertainty, affected assets, proposed action, owner, and final decision. Valve, pump, pressure, and treatment changes must remain subject to operator approval. Never bypass interlocks, maintenance lockouts, or operating procedures.
The use cases below apply this approach to leaks, pressure, pumps, maintenance, customer requests, and reporting.
1. Leak Detection and Burst-Risk Assessment
Start with the best signal source for each asset type, then escalate only the cases with the strongest evidence.
System location and required data
Match signal quality to the asset: mains, district metered areas (DMAs), and customer meters.
For transmission mains, combine acoustic, pressure, and flow signals to screen for leaks and bursts. Across distribution networks, check those signals against hydraulic-model predictions and GIS pipe records.
In DMAs, compare flow balances and minimum nighttime flow with expected demand. At customer connections, use AMI consumption patterns to flag continuous or unusual use.
Agent actions and workflow outputs
Before escalating a case, rule out firefighting, tank filling, planned valve changes, and meter faults.
Rank suspected leaks by the strength of the evidence, estimated leak volume, pipe condition, and potential effects on hospitals, roads, or other critical locations. Create a work order that includes the suspected segment, supporting evidence, estimated leak volume, and next check. Route flagged customer-side leaks through approved notification procedures.
The goal: faster confirmation, fewer false alarms, and better-targeted repairs.
Results and success metrics
Track time to field confirmation, confirmed-leak rate, false-alert rate, location accuracy, inspection cost per confirmed leak, and gallons recovered per day.
Compare results before and after deployment by asset type. After repairs, verify savings by checking whether flow and pressure return toward baseline.
Human oversight and action limits
Treat “probable leak,” “probable burst,” and “elevated burst risk” as different findings - not confirmed leaks or bursts.
Field crews must verify the location and size before excavation or repair. Customer alerts need approved review before release.
Sensor noise, changes in demand, and model errors can mislead the agent. Burst-risk assessment helps prioritize inspections and improve readiness, but it cannot prevent bursts.
2. Meter Analysis and Demand Forecasting
System location and required data
AMI data does more than detect leaks. It also helps improve billing accuracy and short-term demand forecasts. Connect the agent to the AMI head-end, meter-data management system, billing platform, and customer information system to analyze demand at both the customer and system levels.
Use interval reads, meter IDs, service locations, quality flags, meter status, billing history, customer class, and historical use. Add weather data and permitted property data, including building type, square footage, irrigation permits, pools, occupancy changes, and major construction permits. Before analysis, standardize timestamps, normalize intervals, and separate actual readings from estimates.
Agent actions and workflow outputs
For billing checks, flag missing readings, sudden drops, continuous flow, and usage outside each account’s seasonal range. Estimate bills using approved rates and billing dates, then send unusual charges for review. Prepare evidence packets for meter inspections and billing reviews, with interval charts and likely causes.
For short-term demand planning, group readings by pressure zone and produce 24-hour forecasts with prediction ranges to support treatment and pumping decisions.
Loudoun Water used AMI data to support customer leak notifications, with initial contact approximately 72–95 hours after an alert. The utility reported that about 80% of identified leaks were mitigated after the first call - a useful measure of whether alerts lead to action, rather than simply generating more cases.
Results and success metrics
Run an 8- to 12-week pilot and compare it with the current workflow. Track confirmed anomalies, false alerts, inspection yield, and billing-review turnaround time.
Measure forecast error using mean absolute error, mean absolute percentage error where appropriate, and bias. Report results by pressure zone and customer class so systemwide averages don’t hide weak performance.
Human oversight and action limits
Staff control billing decisions. Require approval for adjustments, credits, disputed readings, and shutoff referrals. Unusual consumption alone doesn’t confirm a leak or meter fault.
Restrict access to customer and property records. Log the source readings, recommendation, staff decision, and final resolution. Demand forecasts then feed directly into pressure and pumping decisions.
3. Pressure Control
System location and required data
Demand forecasts from the previous workflow help set zone-level pressure targets for distribution operations. Connect the agent to pressure zones, booster stations, PRVs, and storage tanks. Monitor high- and low-point sensors, zone boundaries, and critical customers. One setpoint can overpressurize low areas while leaving high areas underpressurized.
Give the agent real-time and historical pressure, flow, pump status, valve position, tank level, demand, and elevation data, along with a calibrated hydraulic model. It uses these inputs to test safe setpoint changes before operators approve any adjustments.
Agent actions and workflow outputs
Have the agent test limited changes to booster-pump speeds, PRV setpoints, and tank fill and drawdown schedules. Each recommendation should show expected pressure at critical locations, storage levels, and effects across zones. Include ramp rates and minimum dwell times to prevent abrupt changes that could cause pressure surges.
The agent should enforce hard operating constraints for each pressure zone. Reject any change that violates minimum pressure or fire-flow limits. EPA cites 20 psi as a minimum benchmark, but state, local, and fire-flow requirements may be stricter.
Results and success metrics
Track the number, duration, and severity of pressure violations by zone. Also measure fire-flow performance, surge events, complaints, operator interventions, and pump energy use. Lower average pressure doesn't count as success if service reliability gets worse.
An AWWA Partnership for Safe Water example uses three pressure zones and sleeve valves to keep operating pressure below 80 psi. It recommends at least two critical monitoring sites per zone and checks during maximum-day demand, fire flow, main breaks, and outages.
Human oversight and action limits
Keep SCADA changes subject to operator approval. Engineers should set pressure limits, equipment limits, fire-flow constraints, ramp rates, fallback modes, and escalation contacts. Stale telemetry should trigger a review.
Limit automation to low-risk changes within approved bounds. Emergency actions, large changes, disabled safeguards, and conditions involving negative pressure should require human authorization. Log every recommendation and override, along with the inputs, model version, expected outcome, actual outcome, and operator identity.
4. Pump Scheduling and Energy Use
System location and required data
Once demand forecasts and pressure targets are set, the agent can schedule pumps to run at the lowest cost. This means coordinating pumping across raw-water intakes, treatment-plant pumps, booster stations, storage reservoirs, and wastewater conveyance systems.
The agent needs demand forecasts, equipment status and efficiency, electricity rates ($/kWh), demand charges, and emergency reserve requirements. EPA cites pumping as 55%–90% of drinking-water utility electricity use.
Agent actions and workflow outputs
Turn the forecasts into a rolling 24- to 48-hour pump schedule that specifies pump combinations, run times, speeds, reservoir targets, energy use, and cost. Test the schedule in a hydraulic or process model, then send it to an operator for approval.
Move pumping away from high-cost periods only when treatment contact time, storage turnover, emergency storage, and wastewater wet-well limits remain protected.
Results and success metrics
Track kWh per million gallons pumped, total electricity cost, peak demand, pump starts, reservoir compliance, overflow events, and low-level alarms. Compare these results with a weather- and demand-adjusted baseline.
A San Jose Water case study reported a 30% reduction in energy use and $143,000 in annual savings after using real-time electricity rates and SCADA data to select efficient pumping periods.
Human oversight and action limits
Allow automatic execution only within approved pump combinations and speed ranges. Exclude unavailable pumps, protect emergency reserves, and switch to a predefined fallback schedule if communications fail.
5. Predictive Maintenance and Crew Routing
System location and required data
Once pump and pressure plans are set, the agent can prioritize maintenance to help prevent downtime. Link computerized maintenance management system (CMMS) data with GIS locations, SCADA condition readings, inspection records, and work-order history. Standardize asset IDs first so sensor alerts and past repairs point to the right equipment.
Agent actions and workflow outputs
Rank jobs by failure likelihood and consequence, using signs such as rising vibration, leaks, or repeat breakdowns - not equipment age alone. Predictive maintenance responds to condition signals; preventive maintenance follows fixed intervals. Before dispatch, check technician qualifications, parts, tools, permits, and safety requirements. Use those priorities and checks to create work orders that crews can follow along a planned route.
Group compatible nearby jobs by road miles, not straight-line distance, but only when combining jobs won't delay emergency response. Each draft work order should include the asset ID, supporting evidence, recommended crew, required skills and parts, estimated labor, route, and safety prerequisites. Supervisors approve only jobs that meet safety and staffing rules.
Results and success metrics
Track response time, travel time, and miles per job separately. Measure first-time fix rate, repeat failures, unplanned downtime, parts-related delays, and cost per work order, too. Compare planned and emergency work by asset class. Fewer miles alone don't prove better maintenance.
Human oversight and action limits
The agent drafts and prioritizes work; people approve execution. Require supervisor approval for confined-space entry, energized equipment, excavation, major valve work, critical pumps, traffic hazards, bypass pumping, customer shutdowns, and repairs affecting water quality or pressure. The agent must not authorize work without the required permits.
After the work is complete, staff should record arrival and repair times, miles traveled, materials used, safety incidents, and asset condition before closing the work order.
6. Customer Service and Urgent Reports
This use case covers the front door of operations: billing questions, service appointments, and urgent reports from the public.
System location and required data
Make the agent available through the contact center, portal, app, SMS, and phone. Use controlled APIs to connect it to verified service addresses, account status, billing and payment records, and appointment calendars.
Also connect outage and pressure maps, work-order systems, meter alerts, approved FAQs, conservation rules, and customer communication preferences. Limit access to customer data to what each request requires.
Agent actions and workflow outputs
After verifying identity, the agent can explain bill line items, flag unusual use, provide payment or assistance-program guidance, and schedule approved service visits.
For urgent reports, collect the exact address or location, callback number, incident type, observed hazards, and timing. Then create a ticket or priority work order. Check the report against outage maps, pressure alarms, meter alerts, recent work orders, and known main breaks to match the call to a known outage, leak, or pressure event.
Escalate immediately for suspected contamination, major flooding, sewage backups, loss of service at a critical facility, or any risk to life or property. Give only approved safety instructions, and direct callers to 911 when needed.
Results and success metrics
Track first-contact resolution for billing, scheduling, and routine questions. Also measure appointment completion, abandoned contacts, repeat contacts within 7 and 30 days, and time to emergency escalation.
Review results by channel, language, neighborhood, and incident type. Strong performance on routine requests must not hide missed urgent cases.
Human oversight and action limits
Require step-up verification before sharing account-specific information. Permit only low-risk actions, such as providing duplicate bills or updating notifications. Route ownership changes, refunds, and disconnections to staff.
Do not invent restoration times or treat outage maps as proof that service is normal. State when sources conflict or data is out of date.
Log actions and human overrides. Require staff approval for public notices, including contamination and boil-water communications, and provide a handoff monitored 24/7 for emergency intake.
These contact logs and escalations feed the compliance review in the next workflow.
7. Compliance Reporting and Water-Quality Review
System location and required data
Deploy the agent across treatment plants, monitoring programs, wastewater facilities, labs, and compliance offices. Connect it to SCADA, online sensors, LIMS, sampling records, permits, SOPs, corrective actions, and reporting templates. For drinking water, verify that the lab is EPA- or state-certified and uses approved methods.
Agent actions and workflow outputs
Create a standard record for each sample or observation. Include the facility, sampling point, collection date and time, parameter, result, unit, analytical method, lab, quality-control status, applicable requirement, and source document.
Flag missed or late samples, incorrect sampling locations, noncertified labs, unapproved methods, and inconsistent records. Summarize these exceptions for review. Compare lab results with nearby sensor readings and operating conditions to spot unit or timestamp mismatches. Keep conflicting records for review rather than resolving them automatically.
For wastewater, map each result to its NPDES permit limit, monitoring period, outfall, parameter, unit, method, and reporting destination. Use the exception log as the basis for report-ready metrics.
Results and success metrics
Track automatic match rate, complete evidence links, missed-sample detection lead time, lab-receipt-to-review time, draft-preparation time, and false-positive and false-negative rates. Also measure reviewer-confirmed draft values and corrections made before submission.
Faster drafting isn't success if unsupported values reach the final report.
Human oversight and action limits
Operators, lab staff, and compliance officers must validate exceptions, approve corrections, certify reports, and submit them. The agent must not alter lab results, override permit limits, or declare samples valid. It must not certify or submit reports without explicit authorization.
Keep versioned source data, rules, reviewer decisions, and final submissions. The permittee remains responsible for reporting monitoring results.
These records also support the data-quality and cybersecurity checks that follow.
Data Quality, Cybersecurity, and Operator Oversight
These agents connect to SCADA, AMI, GIS, CMMS, billing, lab, hydraulic models, and customer systems. Use a controlled integration layer with read-only interfaces by default. Never grant direct control of PLCs, pumps, or valves. For each source, define its owner, update rate, units, timestamp standard, asset IDs, quality flags, retention, and allowed uses. Keep original records immutable and log every data transformation. These controls prepare the data for the first pilot workflow.
Before using data for leak detection, forecasting, control, or reporting, check calibration, timestamps, time zones, missing or duplicate readings, communication delays, and asset matches. Check models against current pipe sizes, valve states, elevations, demand assumptions, and recent network changes. Label inputs as valid, stale, estimated, missing, or quarantined. Operators should review historical event labels and test alert thresholds against seasonal demand, fire-flow events, conservation restrictions, weather, and planned shutdowns. Track false alarms, missed events, and detection lead time.
Set four permission levels: observe, recommend, act with approval, and act within approved limits. For actions within set limits, specify allowed assets, operating ranges, time windows, maximum duration, required confirmations, and automatic reversion conditions. Require human review for safety-critical controls, emergencies, chemical dosing, boil-water or other public-health communications, major account or billing changes, service shutoffs, and regulatory submissions. The same applies to any action that could materially affect pressure, fire flow, water quality, or continuity of service. Give operators the evidence, affected assets, expected consequences, and rollback options they need to review each action.
Keep business IT, the integration layer, and operational technology in separate network segments. Allow only monitored connections. Use least-privilege service accounts, separate administrative credentials, encryption, and multifactor authentication where feasible. Protect audit trails that record model and rule versions, recommendations, approvals, commands, overrides, and outcomes. Minimize customer data and restrict detailed AMI access: usage patterns can reveal household routines.
Define failure behavior before enabling actions. Stale or conflicting inputs, lost communications, or insufficient confidence should stop agent actions, alert operators, and leave approved operating logic in charge. Document timeouts, overrides, failover, and rollback procedures. Before production use, test restoration with SCADA vendors, including recovery to validated schedules or setpoints. Record recovery time, missed alarms, and unexpected actions during those tests.
Start With One Workflow and Measure Results
Once controls and permissions are set, choose one narrow task from the seven use cases, such as ranking suspected leaks for field verification. Score each candidate 1–5 for data readiness, expected value, and failure risk, keeping risk separate from value. Favor tasks with reliable records and results staff can check. Set a baseline that accounts for the workflow’s seasonality.
Run the agent in recommend-only mode for several weeks or one operating cycle. It suggests actions but takes none. Operators review its recommendations against the existing process. Track review time, rejected recommendations, and workflow outcomes: confirmed and repaired leaks, forecast error, minutes outside the target pressure range, pumping kWh and cost, maintenance response time and miles driven, first-contact resolution, or report corrections.
Compare similar operating conditions - not just last month with this month. Account for temperature in °F, rainfall, demand restrictions, construction, equipment changes, and service-area growth. For water-loss claims, reconcile gallons saved against the water audit. Distinguish real losses, apparent losses, and unbilled authorized consumption. Lower system input alone does not prove reduced leakage.
Portland Water Bureau’s FY 2023–24 satellite leak-detection project illustrates the chain from detection through field verification and repair to estimated savings: approximately 280 leaks found and repaired, about 85% non-surfacing, and an estimated annual water-loss reduction of 365 million gallons.
Use the pilot results to decide whether to expand. Before doing so, publish a scorecard showing baseline and pilot results, sample size, operating conditions, human effort, total cost, and unresolved risk. Keep measured savings separate from estimates. Require operator approval to scale, and proceed only when the gains hold without worsening safety, service, or workload.
Conclusion: Keep Operators in Charge
AI agents support licensed staff, not replace them. Across these seven workflows, they help utilities spot problems, improve operations, serve customers, and simplify reporting.
Safe use depends on data quality and clear permission limits. Let agents flag issues and prepare drafts, but require authorized staff to approve pressure adjustments, valve changes, chemical dosing, and regulatory submissions. Keep audit logs and manual fallbacks in place.
Operator judgment should shape the system, not just approve its output. A planned hydrant flush can explain a pressure event, and access restrictions can change a crew route. Use that knowledge to correct rules and data mappings without letting the agent expand its own permissions. Measured pilot results - not unrestricted autonomy - should determine what happens next.
FAQs
Can small water utilities use AI with limited sensor data?
Yes. Small water utilities can start with targeted AI pilots instead of a full overhaul. Focus on repetitive tasks with high potential impact and enough existing data. Connect those workflows to maintenance systems to measure results while keeping risk in check.
NAITIVE AI Consulting Agency helps utilities define which assets to include first, assess whether their data is ready, and connect autonomous workflows that can scale.
How much does an AI agent pilot cost?
The cost of an AI agent pilot for a water utility depends on your current infrastructure, use case, and integration scope. A focused pilot lets you test performance and collect feedback before a larger rollout.
NAITIVE AI Consulting Agency helps utilities review their existing systems and plan deployments that fit their budgets. Starting small keeps costs in check and lets you measure ROI through results like better leak detection or more efficient maintenance before expanding across your network.
How can operators detect when AI recommendations become unreliable?
Operators can use performance metrics and real-time dashboards to spot deviations and signs of data drift, such as declining model precision. Error logs can help pinpoint why a model produces unexpected outputs.
When AI confidence drops below a preset threshold, the system should automatically send the task to a human operator for review. Human-in-the-loop checkpoints for complex or high-stakes decisions help catch inaccuracies before they affect system performance.