
Rapid Prototyping ROI for AI Projects
Run 2–4 week prototypes with capped budgets to validate AI assumptions, measure adoption, and estimate payback before scaling.

I’d start with a two- to four-week prototype when an AI project’s main assumptions are untested. Set a budget, measure the current workflow, and define what would make you scale, revise, or stop. I’d move straight to full-scale development only when a similar deployment has already tested the data, integrations, demand, and costs.
My comparison comes down to four questions:
- Cost: What will testing, building, human review, and running the system cost?
- Validation time: How soon can you test model quality, user adoption, and financial returns?
- Risk: Can you use the data legally, handle errors safely, and support live use?
- Return: Do measured gains cover all costs - and still hold if adoption falls 50% or model costs double?
Quick Comparison
| Criteria | Prototype-first | Full-scale-first |
|---|---|---|
| Spending | Capped test budget before production funding | Larger commitment before validation |
| Validation | Tests one workflow early | Tests within the production build |
| Risk | Limits spending on untested assumptions; leaves scale unproven | Tests architecture sooner; risks costly late changes |
| Return | Estimates payback from pilot results | Must confirm payback through live use |
| Best fit | Untested data, demand, or model quality | Previously tested workflows and integrations |
My rule: <u>a working demo is not proof of ROI</u>. I’d count time saved only when it creates usable capacity, lowers spending, or adds revenue - not all three. Then I’d use actual adoption, review time, and running costs to decide whether to expand, with checks at 30, 60, and 90 days.
1. Build a Rapid Prototype First
Investment and Total Cost
Set a total test budget before you build. Account for data preparation, tools, review, and user testing, plus model or API usage, cloud infrastructure, security review, domain-expert time, and project-management overhead.
Estimate production costs separately: integration, monitoring, human escalation, support, retraining, and infrastructure. The test budget sets your spending limit for a fast go/no-go decision.
Time to Validation
With the budget set, focus on one workflow and a two- to four-week test window. Keep the use case narrow, and measure its current processing time, error rate, and cost before building.
Leave time for user testing and ROI analysis - not just development. Extend the test only if more testing can resolve a risk that could change the decision. Extra features alone don’t justify more time.
Technical and Production Risks
If the prototype still looks viable, test it under controlled conditions. Include incomplete records, ambiguous requests, edge cases, and underrepresented inputs.
Run a controlled pilot with trained users, restricted permissions, logging, human approval for high-impact actions, and a rollback procedure. Measure incorrect outputs and their impact on the work, rather than judging whether answers sound plausible.
Document where results don’t carry over to other situations. Compare AI-assisted work with the existing process using the same task sample or a controlled before-and-after test.
Business Value and Payback
If the pilot works, translate the results into a payback estimate. Calculate annual benefit from labor saved, revenue gained, losses avoided, or improved retention.
Use payback in months = (prototype cost + implementation cost) ÷ monthly net gain, where monthly net gain equals monthly benefit minus recurring operating costs. Treat time saved as added capacity unless it reduces spending or creates additional value.
Stress-test the estimate with adoption 50% lower and model costs doubling. Proceed only when the technical and economic thresholds are met. Revise the plan when a change to data, workflow, or oversight can close the gap. Stop when data is unavailable, regulatory exposure is too high, or production costs exceed value.
sbb-itb-f123e37
How to Measure AI ROI and Build Rapid Prototypes
2. Begin Full-Scale Development Before Validation
This path flips the prototype-first approach: spending comes before proof. Production starts sooner, but validation happens later, increasing the risk of sunk costs.
Investment and Total Cost
You fund production architecture, data pipelines, and integrations before proving the model, workflow, or economics. Track spending at each stage, including rebuild costs if assumptions fail. Assign someone to own cloud costs and set usage alerts before work expands.
Time to Validation
Each stage should test another assumption before you commit more money. A finished system does not prove the business case.
Set separate checkpoints for data feasibility, offline model quality, workflow usability, deployment readiness, and pilot results. Give each checkpoint an owner and a decision date, and require evidence before moving forward.
Production Risks
ROI in live deployment can differ from prototype results. Keep integrations modular so you can replace an unsuitable model without rebuilding the workflow.
Test with out-of-time data to reduce data leakage. Measure cost per completed task, not just cost per model call. After deployment, compare live results against offline benchmarks to spot performance drift. Track user overrides and operating costs, too.
Business Value and Payback
Early production work is most defensible when data and integration patterns are already proven, often through NAITIVE AI consulting, such as extending a validated model to another business unit.
Stop spending when a release misses its predefined ROI threshold. High sunk costs are not a reason to keep going. Fund work in stages, and expand only after measuring adoption and confirming realized financial benefit.
Compare Spending and Validation Time
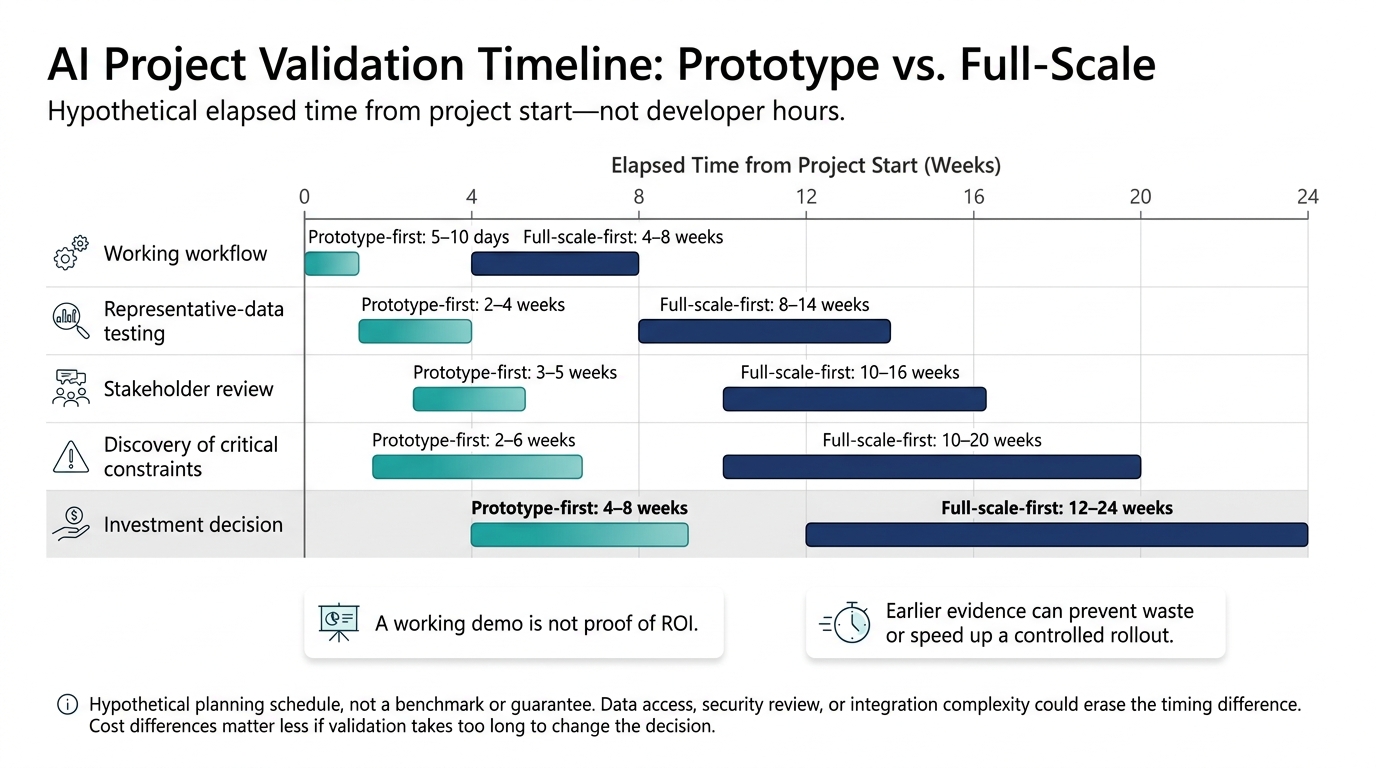
AI Project Validation Timeline: Prototype vs. Full-Scale
Once you set the test budget, compare prototype-first and full-scale-first costs side by side.
Upfront Spending and Total Ownership Costs
Use these comparisons to assess whether rapid prototyping improves risk-adjusted ROI. Compare the same cost categories at both stages. These ranges are hypothetical planning estimates for one limited validation workflow followed by a full production rollout. Replace them with your internal rates, forecasts, quotes, and compliance costs, or consult an AI consulting agency for industry benchmarks.
| Cost category | Prototype stage | Production stage |
|---|---|---|
| Personnel | $15,000–$40,000 | $125,000–$300,000 |
| Data preparation | $5,000–$20,000 | $30,000–$100,000 |
| Model/API usage | $1,000–$5,000 during prototyping | $20,000–$100,000 annually |
| Infrastructure | $2,000–$10,000 | $50,000–$250,000 |
| Integration | $5,000–$25,000 | $75,000–$250,000 |
| Security review | $0–$10,000 | $15,000–$75,000 |
| Governance and compliance | $0–$10,000 | $20,000–$100,000 |
For three-year TCO, include monitoring, maintenance, training, support, and decommissioning. Track annual expenses separately from one-time build costs.
Prototype spending improves ROI only if it changes the later decision. Prototype work lowers total cost only when you reuse assets, such as evaluation tests and data pipelines. Otherwise, treat that work as sunk cost. Count only the rework the prototype can actually prevent.
| Decision measure | Prototype-first | Full-scale-first |
|---|---|---|
| Prototype-stage spending | Separate, capped budget | Testing costs embedded in the build |
| Production-stage spending | Committed after validation | Committed before key assumptions are proven |
| Write-off risk | Discarded prototype work plus remaining redesign | Changes to production work already completed |
Neither approach eliminates rework.
Time to Decision
Measure elapsed time from the project’s start - not developer hours. This hypothetical schedule separates a working demo from evidence you can use to make a decision. Data access, security review, or integration complexity could erase the timing difference.
Cost differences matter less if validation takes too long to change the decision.
| Milestone | Prototype-first | Full-scale-first |
|---|---|---|
| Working workflow | 5–10 days | 4–8 weeks |
| Representative-data testing | 2–4 weeks | 8–14 weeks |
| Stakeholder review | 3–5 weeks | 10–16 weeks |
| Discovery of critical constraints | 2–6 weeks | 10–20 weeks |
| Investment decision | 4–8 weeks | 12–24 weeks |
Earlier evidence can prevent waste or speed up a controlled rollout. Before approving funding, document manual steps and test realistic permissions, edge cases, and operating costs. A polished demo that hides manual steps can inflate ROI.
Compare Risks and Expected Returns
After comparing cost and timing, look at what each path actually proves. Prototype-first tests feasibility early. Full-scale development tests architecture sooner, but it doesn't prove adoption or ROI. Every unresolved risk can delay payback through rework, added controls, review time, or operating costs.
| What it proves | What it still leaves uncertain |
|---|---|
| Prototype-first: Feasibility, sample quality, pilot adoption, and estimated operating cost | Scale, controls, sustained adoption, live costs, and quality |
| Full-scale development: Architecture, integrations, and more detailed cost estimates | Sustained adoption, model drift, operating costs, and realized ROI |
Technical Risks and Readiness for Live Use
Test representative tasks, edge cases, adversarial inputs, end-to-end actions, and human handoffs. Record every result, safeguard, and unresolved risk.
Use the table below to separate what a prototype can test from the evidence needed for full-scale use.
| Risk area | Prototype findings and safeguards | Full-scale evidence to require | Remaining uncertainty |
|---|---|---|---|
| Technical feasibility | Representative tasks, accuracy or completion thresholds, latency tests, failure categories | Production architecture, capacity tests, regression tests, service-level monitoring | Higher volumes, new tasks, unusual inputs |
| Data quality | Data profiling and acceptance thresholds | Quality checks, lineage, access controls, drift monitoring | Whether future data remains comparable |
| Integration complexity | Mock or limited identity, CRM, ERP, ticketing, or telephony connections | End-to-end tests, retries, versioning, rollback, dependency-failure tests | Third-party changes, legacy behavior, maintenance |
| Security | Threat model, access controls, prompt-injection tests, secrets handling, abuse tests | Pen testing, logging, least privilege, incident response, monitoring | New attacks, misconfiguration, supplier risk |
| Privacy | Data minimization, redaction, retention rules, approved test data | Privacy review, audit trails, consent or lawful-use controls, deletion procedures | Re-identification, secondary use, legal changes |
| Governance | Owner, intended use, escalation rules, evaluation set | Approval gates, audit evidence, policy enforcement, model inventory, change control | Accountability when models, vendors, or workflows change |
| Reliability | Failure rates, timeouts, recovery tests, fallback tests | Load tests, resilience tests, disaster recovery, availability, drift tests | Rare and correlated failures |
| Human oversight | Handoff rate, reviewer accuracy, queue capacity, escalation procedure | Role-based review, quality sampling, override logs, staffing, escalation SLAs | Reviewer fatigue, inconsistent judgments, unsafe automation |
| Maintainability | Code quality, reproducible deployment, documentation, update estimates | CI/CD, observability, versioning, regression tests, ownership | Technical debt, vendor changes, maintenance costs |
ROI, Annual Net Benefits, and Payback
Define metrics, owners, and approval thresholds before testing. Choose a baseline period long enough to reflect normal variation. Where feasible, compare similar teams or stagger deployment.
Prototype results point to possible gains; full-scale results must prove those gains last in live use. The thresholds below are planning criteria, not universal benchmarks.
| Metric | Baseline | Measurement and data source | Prototype-first vs. full-scale measurement | Target and investment effect |
|---|---|---|---|---|
| Task time | Manual median and 90th-percentile time | Time studies; workflow timestamps | Sample tasks vs. live task mix | At least 25% faster without quality loss; count only usable capacity |
| Error rate | Defects and critical errors per task | Independent audits; incident logs | Test-set errors vs. sustained live errors | No increase in critical errors; a failed safety gate blocks rollout |
| Throughput | Tasks per productive hour | Transaction volumes; staffing records | Pilot capacity vs. actual completed work | A 20% increase at stable quality supports capacity value |
| Service level | Response time and SLA attainment | Operations dashboards | Pilot timing vs. live backlog and response | Agreed SLA improvement supports service value |
| Adoption | Existing workflow participation | Eligible-user and task telemetry | Pilot participation vs. sustained eligible-task use | Meet planned adoption; otherwise discount benefits |
| Exception rate | Manual corrections and escalations | Case-management records | Test exceptions vs. live exception mix | Stay within staffed capacity; excess requires redesign |
| Human review | Review time and error catch rate | Review logs; quality sampling | Pilot review burden vs. continuing staffing needs | Stay within budget without weakening controls |
| Operating cost | Current cost per completed task | Invoices, usage logs, and engineering time | Estimated live cost vs. observed all-in cost | Cost must remain below value per completed task |
Use the same time horizon and count every cost once.
ROI = ((Quantified Benefits − Total Investment) / Total Investment) × 100. Total investment includes upfront spending and operating costs within that horizon.
Annual net benefits = annual quantified benefits − annual operating costs.
Simple payback = upfront investment ÷ positive, sufficiently stable annual net benefits. The result is in years.
Report prototype learning and avoided commitments separately from recurring production returns. Count saved time once - as capacity, lower expense, or revenue, not all three.
| Scenario | Adoption | Usage and integration costs | Sustained quality and benefits | Decision use |
|---|---|---|---|---|
| Conservative | Slow rollout; limited eligible-task use | Higher usage costs, integration expense, and review burden | Modest measured savings; no unverified revenue uplift | Hold or redesign if returns fail the investment threshold |
| Base case | Planned, sustained use | Budgeted usage, integration, and maintenance costs | Gains supported by the baseline hold | Expand when measured returns and safeguards meet thresholds |
| Upside case | Broad eligible-task adoption | Lower unit costs, but scale still requires spending | Strong gains supported by evidence | Expand only with verified gains - not upside projections alone |
Advantages, Drawbacks, and Best-Fit Conditions
A separate prototype adds little value when prior deployments, stable data, established integrations, and approved controls have already settled the main uncertainties. Even then, keep staged releases and production-like acceptance tests.
| Path | Advantages | Drawbacks | Best-fit conditions | Remaining uncertainty |
|---|---|---|---|---|
| Prototype-first | Smaller initial commitment; earlier learning; option to stop | Limited testing coverage; possible throwaway work and rebuild costs | Uncertain demand, data, model quality, autonomous actions, or handoffs | Scale, controls, maintainability, and sustained value |
| Full-scale development before validation | More complete architecture; avoids duplicating already-proven work | Larger early commitment; costly late changes | Well-tested requirements, stable workflows, known controls, and established architecture | Adoption, drift, operating costs, and benefit realization |
| Either path with staged release | Tests live behavior while limiting exposure | Requires monitoring, review staffing, and rollback capability | Controlled expansion after acceptance testing | Rare failures and longer-term performance |
Conclusion: Choose Based on Test Results
Start with a prototype when key assumptions are still untested. Go straight to full-scale development only when a similar deployment has already proven the use case, data, integrations, demand, and operating economics. You’ll still need testing and monitoring.
Before spending more, lock the test design. Focus on one measurable problem and assign one business owner. Document the baseline, then write a validation charter that sets the scope, representative data, duration, budget, exclusions, decision rights, and go/no-go thresholds. Test both normal work and failure cases, including outages, unsafe inputs, and broken handoffs.
Let the results guide the scale-up decision. Recalculate the economics using actual adoption, review load, integration effort, and recurring costs. Record your choice: scale, revise and retest, pause, or stop.
If you roll out, keep checking live results against the original forecast. Review benefits and risk at 30, 60, and 90 days, then at set intervals. Maintain a benefits register with the owner, forecast value, measurement method, and actual results.
For implementation support, NAITIVE AI Consulting Agency helps design and manage AI solutions, autonomous agents, phone and voice agents, AI automation, and business process automation, with clear acceptance criteria, governance, and delivery responsibilities.
FAQs
How do I choose the best AI workflow to prototype?
Choose a workflow with measurable financial gains and results you can verify. Focus on high-volume, repetitive, rule-based tasks that take substantial manual effort and have clear costs and returns per task.
Document 3–6 months of baseline data: task volume, cycle time, and fully loaded labor costs. Then assess the workflow’s potential impact and whether it fits your business goals and infrastructure.
Start with one workflow, one owner, and one metric. Run a short pilot to validate ROI, comparing results with a control group or past seasonal patterns before scaling.
How much pilot data is enough to trust ROI estimates?
Use at least 90 days of pre-deployment baseline data for the pilot’s target KPIs. This helps account for normal variation and seasonality and supports sign-off from finance and operations.
For better KPI setup and before-and-after comparisons, use 12 months of historical data on operating costs, manual processing time, error rates, and customer satisfaction.
During the pilot, report results at 30, 90, 180, and 365 days to confirm when value stabilizes.
How do I value AI benefits without cutting headcount?
Focus on capacity and throughput, not cutting labor costs. Track how much more work your team completes after AI automates repetitive, high-volume tasks.
For example, if 10 analysts increase output from 40 to 65 reviews per quarter without new hires, the value comes from avoiding the cost of hiring 3 to 4 additional staff members.
This helps your team grow efficiently while freeing up time for higher-value planning and decision-making.