How to Measure AI Model Energy Efficiency
Measure and reduce AI model energy use with key metrics (PUE, kWh, CO₂, inferences/J), monitoring tools, benchmarking, and phase-specific optimizations.

AI models consume massive amounts of energy, making efficiency critical for cost savings and meeting regulations. Training a single large model can use hundreds of megawatt-hours (MWh), and daily AI queries consume electricity equivalent to 35,000 U.S. homes annually. This guide explains how to measure energy use, reduce waste, and track carbon emissions.
Key metrics include:
- Power Usage Effectiveness (PUE): Measures data center energy efficiency.
- Energy Consumption (kWh): Tracks electricity usage during tasks.
- Carbon Footprint (kg CO2eq): Calculates environmental impact based on regional energy sources.
- Inferences Per Joule: Evaluates model efficiency in energy use.
Tools like CodeCarbon, CarbonTracker, and CentML DeepView help monitor and optimize energy use. Following these steps, you can improve efficiency, cut costs, and comply with regulations like the EU's Corporate Sustainability Reporting Directive.
Quick Tip: Use consistent benchmarks, measure phase-specific energy use (e.g., prefill vs. decode), and compare models by balancing efficiency with performance. Start small by optimizing batch sizes or selecting energy-efficient data centers.
Calculating our AI energy consumption
Key Metrics for AI Energy Efficiency
Key Metrics for Measuring AI Model Energy Efficiency
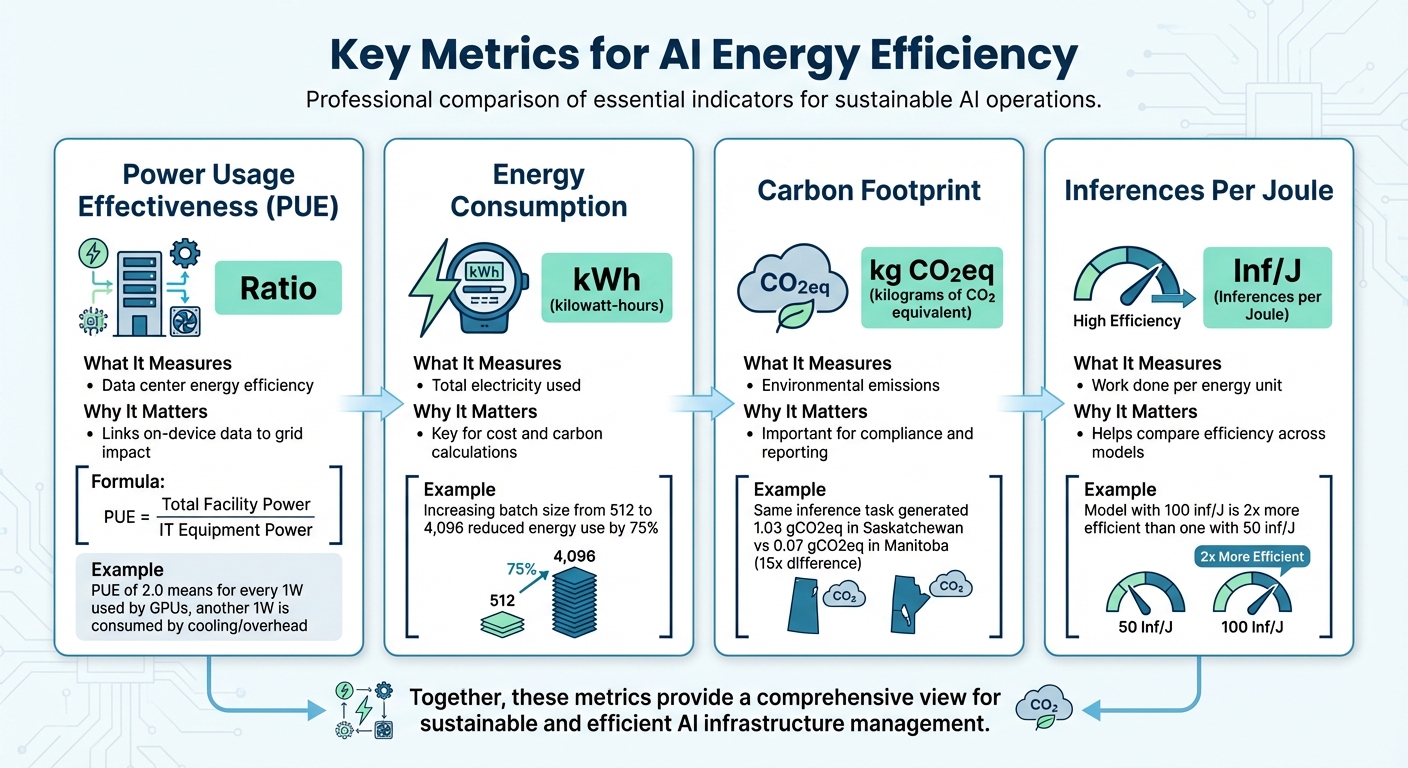
Measuring energy consumption is the first step toward improving AI efficiency. Four main metrics are essential for understanding and optimizing energy use: Power Usage Effectiveness (PUE), energy consumption in kilowatt-hours (kWh), carbon footprint in kilograms of CO2 equivalent (kg CO2eq), and inferences per joule. These metrics provide insights into how efficiently your AI models operate and help pinpoint areas for improvement.
Power Usage Effectiveness (PUE)
PUE evaluates how efficiently a data center uses energy by comparing the total power consumed by the facility to the power delivered to IT equipment.
PUE = Total Facility Power / IT Equipment Power.
A PUE of 1.0 indicates perfect efficiency - though this is nearly impossible to achieve. For instance, a PUE of 2.0 means that for every watt used by your GPUs, another watt is consumed by cooling, lighting, and other overhead systems.
For AI workloads, PUE acts as a multiplier, connecting on-device energy measurements to the actual power drawn from the grid. For example, researchers at the National Renewable Energy Laboratory examined an 8-GPU NVIDIA H100 HGX node in December 2024. They found its maximum power usage during training was 8.4 kW - 18% lower than the manufacturer’s rated 10.2 kW. Applying the data center’s PUE to this figure gives a more accurate picture of its energy footprint. As Akshaya Jagannadharao et al. explain, "Measuring energy is a crucial step towards reducing carbon footprint, [but] it is also not straightforward".
Energy Consumption in Kilowatt-Hours (kWh)
kWh is the standard unit for measuring energy use, making it critical for calculating both costs and environmental impact. This metric captures the total electricity consumed during a training session or inference task.
For example, increasing batch sizes from 512 to 4,096 images during ResNet training on an 8-GPU NVIDIA H100 HGX node reduced energy use by 75%. Similarly, the ML.ENERGY Benchmark team demonstrated in early 2025 that automated optimization strategies could cut energy consumption by over 40% without affecting the model's performance.
Carbon Footprint (kg CO2eq)
Carbon footprint translates kWh into environmental impact by factoring in the carbon intensity of the electricity grid (measured in gCO2eq/kWh). Location plays a major role here. In June 2025, researchers using the AIMeter toolkit ran an inference test with the Llama2-7b model, which consumed 7,485 Joules (2.08 Wh). When performed in Saskatchewan, Canada, this task generated 1.03 gCO2eq, compared to just 0.07 gCO2eq in Manitoba - a nearly 15-fold difference due to variations in grid intensity.
It’s also important to distinguish between average intensity (the general grid mix) and marginal intensity (the power source activated to handle additional demand). Marginal intensity often provides a more accurate reflection of your direct environmental impact. For example, real-time carbon intensity can vary by as much as 7.9x in the Western U.S. and 19.5x in Central Europe between neighboring regions.
Inferences Per Joule and GPU Watt-Hour Usage
Inferences per joule measures the efficiency of your model, showing how much work it accomplishes for each unit of energy used. A model producing 100 inferences per joule is twice as efficient as one achieving 50, regardless of hardware differences. Meanwhile, GPU watt-hour usage tracks the power draw during specific workload phases.
For large language models, understanding phase-specific energy demand is crucial. The "Prefill" phase (processing the initial prompt) typically requires much more power than the "Decode" phase (generating tokens), sometimes drawing an additional 90 W. Measuring these phases separately allows for targeted optimizations, whether your focus is cutting costs or achieving environmental goals.
| Metric | Unit | What It Measures | Why It Matters |
|---|---|---|---|
| PUE | Ratio | Data center energy efficiency | Links on-device data to grid impact |
| Energy Consumption | kWh | Total electricity used | Key for cost and carbon calculations |
| Carbon Footprint | kg CO2eq | Environmental emissions | Important for compliance and reporting |
| Inferences Per Joule | Inf/J | Work done per energy unit | Helps compare efficiency across models |
Step 1: Choose Your Measurement Tools
Picking the right measurement tool depends on your hardware setup, environment, and tracking goals. These tools typically monitor power consumption for your CPU, GPU, and RAM, then translate that data into carbon emissions based on the carbon intensity of your local electricity grid. Popular choices include CodeCarbon, CarbonTracker, and CentML DeepView, each suited to different needs.
CodeCarbon works well for general tracking purposes. It supports a range of hardware, including NVIDIA GPUs (via nvidia-ml-py), Intel and AMD CPUs (using RAPL files on Linux), and Apple Silicon (via powermetrics with sudo access). The tool calculates CO₂ emissions by multiplying energy usage (in kilowatt-hours) by the carbon intensity of your region's electricity grid. To keep system overhead low, it measures energy consumption at 15-second intervals. You can easily integrate it into Python scripts with the @track_emissions decorator or a context manager. For non-Python programs, use the CLI command: codecarbon monitor -- <your_command>. If you're working in an offline environment, CodeCarbon offers an offline mode where you can manually set the country_iso_code to fetch local carbon intensity data.
CarbonTracker is tailored for HPC and Slurm-based clusters. It offers real-time tracking and "intelligent predictions", which estimate total emissions after just one training epoch. As of January 2025, CarbonTracker has been referenced in over 660 publications and downloaded more than 117,000 times on PyPI. Use it via the CLI (carbontracker python script.py) or integrate it directly into your training loops with the tracker.epoch_start() and tracker.epoch_end() methods.
CentML DeepView provides a user-friendly interface and a VSCode plugin, making it ideal for real-time monitoring during model development. Other tools, like Eco2AI and Tracarbon, focus on function-level tracking, while Hugging Face supports adding carbon footprint metadata - calculated using tools like CodeCarbon or the ML CO₂ Calculator - directly to model cards.
| Tool | Best For | Real-Time Tracking | Hardware Support |
|---|---|---|---|
| CodeCarbon | General ML tracking & regional data | Dashboard after run | CPU, NVIDIA GPU, RAM |
| CarbonTracker | HPC clusters & emission estimates | Yes (Live updates) | CPU, NVIDIA GPU, Apple Silicon |
| CentML DeepView | VSCode users & interactive analysis | Yes (Inline) | Most GPUs |
| Eco2AI | Function-specific tracking | No | CPU, GPU |
Choosing the right tool is key to gaining meaningful insights into energy use. This helps you cut down on energy waste, reduce your carbon footprint, and stay compliant with regulations. Once you've selected your tool, the next step is setting up a benchmarking environment to ensure accurate energy measurements.
Step 2: Set Up Your Benchmarking Environment
Once you've chosen your measurement tool, it's time to create a controlled setup that ensures consistent and comparable results. Without standardization, your benchmarks might vary too much to provide meaningful insights into energy efficiency.
Define Standard Workloads
Setting up consistent workloads is essential for accurate energy efficiency comparisons. Start by determining the specific tasks you'll use for testing. These tasks should reflect practical applications, such as text generation, image classification, object detection, and automatic speech recognition. To maintain consistency, use standardized datasets with approximately 1,000 samples. For example:
- Text tasks: Consider datasets like WikiText, OSCAR, or UltraChat.
- Vision tasks: Use options like COCO 2017, Visual Genome, or ImageNet.
Keep the batch size fixed at 1 for all tests. This eliminates discrepancies caused by varying workload management strategies, ensuring you're measuring the model's efficiency rather than differences in hardware performance. Stick to consistent numerical formats: use FP16 for text generation and FP32 for summarization, image classification, and ASR tasks. For large language models, separate the prefill and decode stages during testing, as these phases consume energy differently.
Select AI Models
Pick models that are widely used and relevant to real-world scenarios. Platforms like Hugging Face Hub are great resources for open-source models. When benchmarking text generation, organize models by their parameter count:
- Models under 20 billion parameters (suitable for a single consumer GPU)
- Models between 20 and 66 billion parameters
- Larger models that require multiple cloud GPUs
For proprietary models, ensure you have confirmation that the tested version matches the production model, including its quantization settings. Also, make sure your hardware and software configurations align with these parameters to maintain consistency.
Hardware and Software Setup
Run all benchmarks on the same hardware to ensure fair comparisons. For instance, using NVIDIA H100 GPUs across all tests helps eliminate hardware variability. Choose hardware with built-in power sensors, such as Intel CPUs with RAPL, NVIDIA GPUs with NVML, or Apple Silicon monitored via powermetrics.
On Linux systems, make sure your tool has access to system interfaces like /sys/class/powercap/intel-rapl:0/energy_uj for Intel CPUs. For Apple Silicon, you can simplify benchmarking by adding this line to the sudoers file:
your_username ALL=(ALL) NOPASSWD: /usr/bin/powermetrics
This setup allows you to run benchmarks without needing root privileges. In HPC environments using Slurm, use the CUDA_VISIBLE_DEVICES variable to isolate GPUs. If you're working in Docker, include the --pid=host flag so NVML can correctly track GPU processes.
Step 3: Measure and Log Energy Metrics
Tracking energy usage is essential when evaluating AI models. This step involves running tests and logging detailed metrics to understand how much power your models consume during actual operations.
Run Training and Inference Tests
Start by using tools like AIMeter to monitor energy consumption. Commands such as monitor.start(sampling_interval=0.1) and monitor.stop() will help you begin and end the monitoring process. Set your sampling interval between 0.1 and 0.2 seconds to accurately capture power fluctuations during different execution stages. This high-resolution sampling is critical because AI tasks often show uneven power consumption.
For large language models, it's important to distinguish between the prefill and decode phases. For example, in a 2025 Llama2-7b experiment on an NVIDIA A800 GPU, the prefill phase consumed nearly 90W more peak power than the decode phase. The prefill phase is compute-intensive, causing significant power spikes, while the decode phase is memory-focused, resulting in steadier power usage. Understanding this difference helps pinpoint areas where optimization will yield the most benefits.
While monitoring, log key metrics such as real-time power (in Watts), total energy consumption (in Joules or kWh), GPU utilization, and throughput (tokens per second). Don’t forget to track CPU and RAM usage as well, as these can reveal bottlenecks outside the GPU that might waste energy. Once you've gathered these metrics, you’ll be ready to submit your data for standardized benchmarking.
Submit Data for Benchmarking
After collecting detailed logs, compare your results using recognized industry benchmarks. Platforms like AI Energy Score allow you to submit your data for comparative analysis. This system uses tools like CodeCarbon and Neuralwatt to assign energy efficiency ratings ranging from 1 to 5 stars. Models in the lowest 20% of energy usage earn 5 stars, while those in the highest 20% receive only 1 star.
"The highest 20% of models by GPU energy get 1 star, while the lowest 20% of models get 5 stars." - AI Energy Score
When submitting your logs, ensure they are accurate and reflect the model version used in production. The rating system is updated every 6 to 9 months to account for advancements in the field, meaning your benchmarks will stay relevant as technology evolves. Participating in these comparisons not only shows where your models rank but also highlights areas for potential improvement.
Step 4: Analyze Energy Efficiency and Carbon Footprint
Now that you've gathered your energy logs, it's time to turn raw data into actionable insights. This involves calculating carbon emissions, factoring in facility overhead, and comparing different models to strike the best balance between performance and energy use. These steps naturally build on earlier discussions about measurement tools and benchmarking.
Calculate Carbon Emissions
Using the metrics you've established, calculate carbon emissions by multiplying energy consumption (in kWh) by the regional carbon intensity (measured in gCO₂eq/kWh). The total energy usage should include the power consumed by the GPU, CPU, and RAM throughout the task. Carbon intensity depends on your region's energy mix - essentially, the proportion of fossil fuels versus renewable energy sources.
Geography plays a big role here. For example, coal-heavy grids can produce up to 995 kg of CO₂ per MWh, while wind power generates as little as 26 kg of CO₂ per MWh. If specific regional data isn’t available, you can fall back on the global average of 475 gCO₂eq/kWh.
Whenever possible, use marginal carbon intensity instead of the average. Marginal intensity reflects the power plants that are actually activated to meet your AI workload. Tools like Electricity Maps and WattTime provide real-time marginal intensity data to make your calculations more precise.
Measure PUE and Facility-Level Efficiency
Power Usage Effectiveness (PUE) is a key metric for understanding how efficiently your data center operates. It compares the total energy used by the facility to the energy consumed solely by IT equipment. While tools like NVML or RAPL can track power usage at the component level, they often miss overheads like cooling, lighting, and power supply losses. To account for these, multiply your on-device energy measurements by the facility's PUE.
For a more comprehensive view, consider "at-the-wall" measurements, which use physical meters to capture total energy consumption. These measurements include factors often overlooked by software monitoring, such as power supply inefficiencies and fan usage. Empirical measurements frequently reveal discrepancies between real-world energy use and theoretical ratings, highlighting the importance of accounting for facility-level overheads. Once you have a full picture of energy usage, you can move on to aligning these metrics with model performance.
Compare Models by Efficiency and Accuracy
The goal isn’t just to find the model with the lowest energy use - it’s about identifying a model that balances energy efficiency with performance. This step combines energy metrics like inferences per joule or energy per task with traditional performance indicators such as accuracy, throughput, and latency.
For instance, increasing the batch size for a ResNet classifier from 512 to 4,096 can slash training energy consumption by up to 75%. Similarly, automated optimization tools have achieved energy savings exceeding 40% without compromising computational results. Resources like ML.ENERGY provide standardized leaderboards that compare over 40 popular model architectures, helping you focus on optimizing the most energy-intensive phases of your workflows.
Step 5: Interpret Results and Optimize AI Models
Use Comparative Analysis
Once you've logged your energy metrics, it's time to dig deeper with comparative analysis. This process helps you identify where energy costs outweigh performance benefits. A simple comparison table can do wonders here, laying out key factors like energy consumption, CO₂ emissions, performance metrics (accuracy or F1 score), and an efficiency rating for each model. Including the Scalar Carbon-Aware Score (SCAS) in your analysis is particularly helpful. This metric blends normalized performance with carbon impact, offering a clear ranking system. For instance, if a larger model only improves accuracy by 1% but triples the carbon footprint, the leaner model is probably the better option.
"Carbon-aware benchmarking changes the relative ranking of models and encourages architectures that are simultaneously accurate and environmentally responsible." - KC Santosh et al.
Armed with this comparative data, you can focus on refining your models to strike a balance between performance and energy efficiency.
Optimize Model Architectures
After identifying which models are energy hogs, it's time to streamline them. Techniques like model pruning (removing unnecessary parameters) and quantization (reducing bit precision) can cut energy consumption significantly without compromising accuracy. This is especially important when you consider that inefficient optimization can make standard NLP models up to 2,000 times more energy-intensive - and transformer-based models even worse, at up to 3,000 times higher.
Since inference typically accounts for 70% of the energy used in an MLOps pipeline, it's a prime target for improvement. Practical steps include tweaking hyperparameters like batch size and finding the right balance between model size and request-handling capacity. These adjustments can lead to meaningful energy savings.
"Optimizing architectures, hyperparameters, and hardware can significantly reduce energy consumption without sacrificing performance." - Adrián Sánchez-Mompó et al.
As you measure improvements, keep device-specific energy coefficients in mind. These will help you determine whether the bottleneck lies in arithmetic operations or data movement.
If you're looking for expert guidance, organizations like NAITIVE AI Consulting Agency specialize in helping teams optimize AI models for high performance while keeping energy use in check.
Conclusion
Measuring the energy efficiency of AI models isn’t just about cutting costs - it’s about creating systems that are both efficient and environmentally responsible. The move from focusing solely on accuracy to incorporating metrics like energy consumption (kWh) and carbon emissions (kg CO2eq) marks a major shift in how AI performance is assessed. By factoring in these additional metrics, you can achieve strong performance while keeping sustainability front and center. As Guoming Tang from HKUST (Guangzhou) emphasizes:
"It is imperative to treat energy/carbon impact as a first-class metric in AI development and deployment".
This guide provides the tools and strategies to help you measure and improve energy efficiency right away. Incorporate these practices into your processes, and don’t overlook the role geography plays in carbon output.
By adopting these strategies, you not only improve operational efficiency but also set the stage for significant financial savings. Start with practical steps like optimizing batch sizes to minimize energy use, selecting data centers with lower real-time carbon intensity, and ensuring your hardware aligns with your workload. These adjustments can lead to meaningful energy reductions without compromising model performance. Considering that training costs can reach thousands of dollars and inference energy adds up over time, these measures can make a big difference. Standardized reporting and phase-specific optimizations also help manage costs and align with regulations like the EU’s Corporate Sustainability Reporting Directive.
For tailored support in implementing these energy-saving practices across your AI systems, NAITIVE AI Consulting Agency offers expertise in designing solutions that balance top-tier performance with environmental consciousness.
FAQs
How do I measure total energy use, not just GPU power?
To get a full picture of energy usage beyond just GPU power, it's important to track the power consumption of the entire system - this includes CPUs, memory, and peripherals. One way to do this is by measuring energy use directly at the wall socket, which captures the system-wide power draw. Tools like AIMeter, Carbontracker, and ML.ENERGY can help by offering detailed insights into hardware performance, overall power usage, and even the associated carbon footprint. These tools ensure you have a thorough understanding of your system's energy consumption.
Should I use average or marginal carbon intensity for CO2 calculations?
It's often advised to calculate CO2 emissions using the carbon intensity of the electricity consumed instead of relying on an average figure. CodeCarbon recommends this approach, which involves multiplying the carbon intensity (measured in grams of CO2 per kWh) by the energy consumed (in kWh). This method offers a more precise estimate by reflecting the actual energy source mix used during tasks like model training or inference, rather than depending on a generalized average.
What’s the best way to benchmark prefill vs. decode energy for LLMs?
To effectively compare the energy usage of prefill and decode stages in large language models (LLMs), it's crucial to use phase-specific energy measurements. Here's how it works:
- Prefill: This is the energy consumed while processing input data.
- Decode: This stage measures the energy used to generate output tokens.
By leveraging tools like AIMeter, you can uncover energy usage patterns. Interestingly, while decoding often accounts for the majority of energy consumption, inefficiencies during the prefill stage can still have a noticeable impact. Analyzing these phases separately allows for better insights and helps improve energy efficiency across the board.