https://huggingface.co/spaces/galileo-ai/agent-leaderboard
Open-source leaderboard testing AI agents on 100 multi-step business scenarios, comparing Action Completion, Tool Selection, cost, and industry performance.

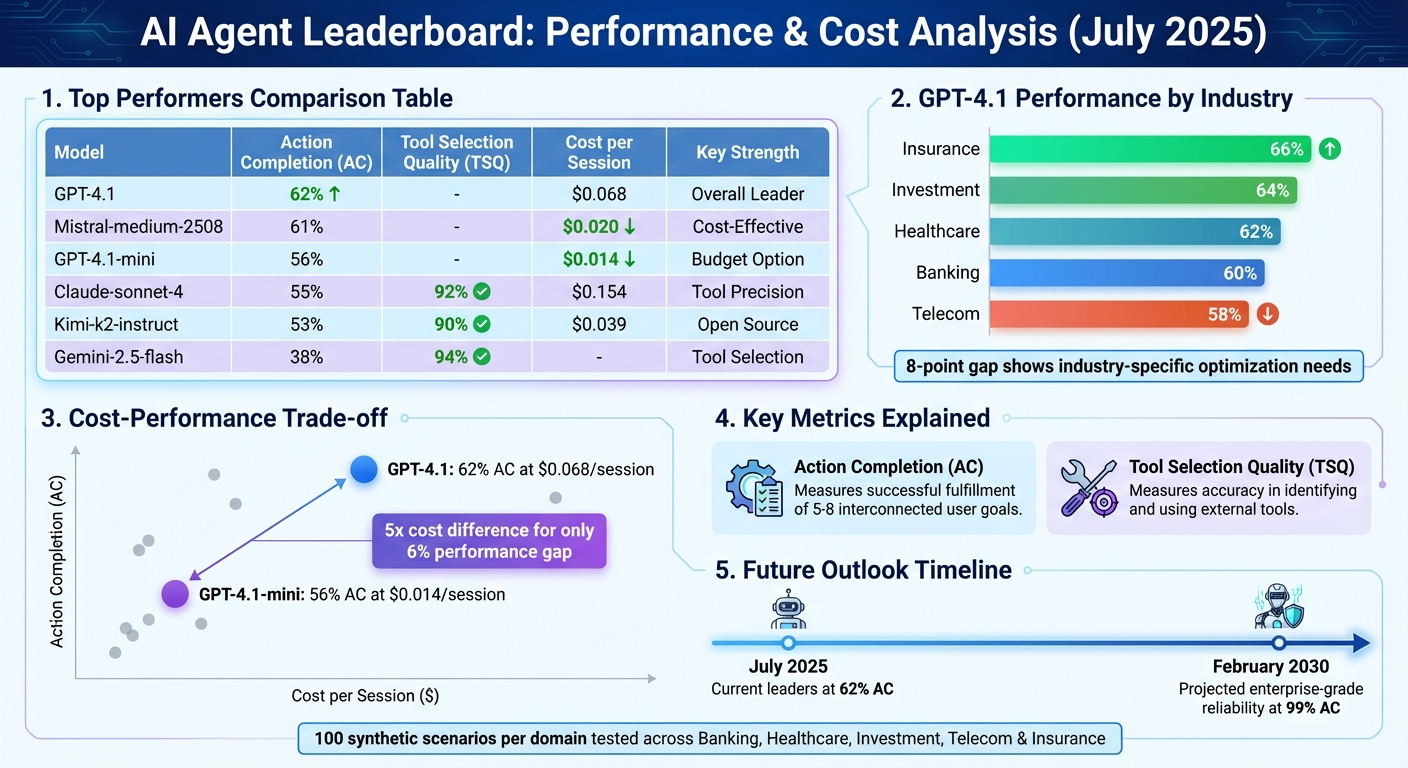
The Galileo AI Agent Leaderboard evaluates AI agents in complex, multi-step business scenarios across industries like banking, healthcare, and insurance. Unlike traditional benchmarks, it tests agents in 100 simulated scenarios per domain, focusing on metrics like Action Completion (AC) and Tool Selection Quality (TSQ). As of July 2025, GPT-4.1 leads with a 62% AC score, while Gemini-2.5-flash achieves 94% TSQ but struggles with task completion (38%).
Key takeaways:
- Performance by Industry: GPT-4.1 scores highest in insurance (66%) and lowest in telecom (58%).
- Cost Efficiency: GPT-4.1-mini offers 56% AC at $0.014/session, compared to GPT-4.1’s 62% AC at $0.068/session.
- Future Outlook: AI agents may reach enterprise-grade reliability (99% AC) by February 2030.
The leaderboard provides transparent, open-source evaluation tools, helping businesses and developers balance performance, cost, and reliability when selecting AI solutions.
AI Agent Performance Comparison: GPT-4.1 vs Leading Models Across Key Metrics
AI Agent Evaluation | Pratik Bhavsar, Galileo
How the Leaderboard Works
The leaderboard relies on a three-part simulation engine designed to mimic real-world business scenarios. It brings together three key elements: an AI Agent (the model being tested), a User Simulator (a generative AI representing a specific user persona), and a Tool Simulator (offering synthetic responses based on predefined schemas). This setup creates dynamic, multi-turn conversations where the AI agents must juggle 5–8 interconnected user goals while keeping the dialogue context intact.
Each agent is tested against 100 synthetic scenarios per business domain, spanning industries like banking, healthcare, investment, telecom, and insurance. Unlike traditional benchmarks that focus on isolated API calls, this approach evaluates how well the agents navigate complex, messy situations - handling ambiguous user requests, missing tools, and shifting priorities.
"Galileo's methodology goes far beyond simple prompt-and-response testing. Each agent is placed into 100 synthetic scenarios per domain, simulating enterprise-grade environments." – Robert Hiett, Public Sector Learning Lab
The scoring process uses LLM judges, often Anthropic's Claude or GPT-4o, supported by ChainPoll technology. These judges collect multiple independent evaluations for every interaction. The final score reflects the percentage of positive assessments, and all models are tested under identical conditions.
Leaderboard Operations and Processes
The platform builds on its robust simulation framework with interactive, real-time evaluations. It operates on Hugging Face Spaces, utilizing Gradio to provide an interface where developers can explore rankings, submit models, and dive into performance data. Developers can easily submit new models for testing through the "Add Model" feature on Hugging Face Spaces or GitHub.
To ensure rankings remain relevant, the leaderboard is updated monthly to include the latest LLM releases. Performance is calculated using an equally weighted average across multiple datasets, focusing on two core metrics: Tool Selection Quality (TSQ) and Action Completion (AC). The evaluation framework pulls data from 14 diverse benchmarks, including BFCL, τ-bench, xLAM (covering 21 domains), and ToolACE (covering 390 domains).
Main Features of the Leaderboard
Transparency is a cornerstone of the platform. The entire benchmarking process is open source, with all code, scenarios, and datasets available on GitHub and Hugging Face for community validation. This openness ensures developers can fully understand the evaluation process and even replicate results independently.
The leaderboard also includes interactive visualization tools to help users interpret complex performance data. Features like radar charts, heatmaps, and scatter plots offer a clear breakdown of trade-offs between factors such as speed, cost, and accuracy. Additionally, cost tracking tools display average session costs, enabling users to calculate "Performance per Dollar" and make smarter budget decisions. For instance, comparing Gemini-2.5-flash-lite at $0.004 per session with Grok-4 at $0.239 per session provides actionable insights for cost-conscious planning.
Another standout feature is the generation of Model Performance Cards, which summarize key metrics and highlight domain-specific strengths. These cards make it easier for developers to communicate results internally and justify model choices based on specific business goals. Together, these features provide a comprehensive framework for benchmarking and optimizing AI agents, setting the stage for the upcoming section on NAITIVE AI Consulting Agency's applications.
Evaluation Metrics for AI Agents
Quantitative metrics form the backbone of the leaderboard's ability to represent how AI agents perform in practical scenarios. Two key metrics are used to gauge effectiveness in real-world business contexts. Action Completion (AC) measures whether an agent successfully fulfills all user objectives - typically 5–8 interconnected goals within a single conversation - and confirms each request along the way. As of July 2025, GPT-4.1 leads with a 62% AC score, while Gemini-2.5-flash trails at 38%.
Tool Selection Quality (TSQ) focuses on how accurately an agent identifies and uses the appropriate external tools while ensuring all required parameters are correctly handled. While Gemini-2.5-flash achieved an impressive 94% TSQ score, this highlights that excelling in tool selection alone isn’t enough.
Performance Metrics
In addition to AC and TSQ, the leaderboard evaluates efficiency through three metrics: Average Cost ($) per session, Average Duration (seconds) for task completion, and Average Turns needed to resolve tasks. For example, GPT-4.1-mini costs a mere $0.014 per session while maintaining a 56% AC score, making it an attractive choice for high-volume, lower-complexity tasks. In comparison, GPT-4.1 costs $0.068 per session with a slightly higher AC score of 62%.
For customer-facing applications, response times under 3 seconds are critical to maintaining user satisfaction. Current data shows GPT-4.1 completes sessions in an average of 24.3 seconds, whereas Kimi-k2-instruct takes a significantly longer 163.6 seconds. While consumer apps often prioritize cost and speed, healthcare applications may lean more heavily on accuracy and safety.
Moving beyond efficiency, the next set of metrics examines how well AI agents handle challenges and unexpected situations.
Robustness and Safety Metrics
The leaderboard also evaluates how agents manage edge cases, such as irrelevant inputs, missing tools, or failed functions. The data reveals that even leading models struggle here, with averages of 0.60 for detecting tool misses and 0.73 for handling missing functions.
"The difference between an AI agent that occasionally works and one that consistently delivers value lies in how well you can measure, understand, and improve its performance." – Conor Bronsdon, Head of Developer Awareness, Galileo
Safety assessments include criteria like detecting prompt injections, identifying personally identifiable information (PII), and applying toxicity filters to avoid security risks and ensure compliance. Models with lower TSQ scores often require additional validation layers and structured methods for error recovery to maintain reliability. For example, deploying real-time protection systems to review prompts and responses before they reach users can help prevent costly errors in enterprise settings.
Top AI Agents and Their Industry Uses
High-Performing AI Agent Examples
GPT-4.1 from OpenAI leads the pack with a 62% Action Completion (AC) score, excelling at handling multi-step user requests seamlessly. Close behind is Mistral-medium-2508, boasting a 61% AC score and a session cost of $0.020.
Anthropic’s Claude-sonnet-4 secures the fourth spot, with a 92% Tool Selection Quality (TSQ) and a 55% AC score at $0.154 per session. For organizations that require precise API interactions, this combination offers strong potential.
In the open-source category, Kimi‑k2‑instruct from Moonshot AI stands out with a 53% AC score, a 90% TSQ, and a session cost of $0.039. Meanwhile, GLM‑4.5‑air matches the 94% TSQ of Gemini‑2.5‑flash while maintaining its open-source nature, making it an appealing choice for teams prioritizing transparency in their AI systems.
"Performance varies dramatically by industry - no single model dominates all domains." – Pratik Bhavsar, Galileo Labs
These metrics provide a foundation for assessing how these agents perform across different industries.
Industry Applications
When applied to specific industries, these AI agents demonstrate varying levels of success depending on the complexity of the domain. For instance, GPT-4.1 achieves its top score of 66% in the Insurance sector. In Investment contexts, it performs slightly less effectively with a 64% AC score.
In Healthcare, GPT-4.1 maintains a solid 62% AC rate. For Banking tasks, the score drops to 60%, and in Telecom, it decreases further to 58%.
The 8-point difference between Insurance and Telecom highlights how domain-specific challenges can significantly impact performance. For industries with lower scores, companies may need to conduct additional testing to ensure the chosen AI model aligns with their unique operational needs. A more cost-effective option, GPT‑4.1‑mini, delivers a 56% AC score at just $0.014 per session.
NAITIVE AI Consulting Agency's Use of Leaderboard Data
Benchmarking and Improving AI Agents with Leaderboard Data
NAITIVE taps into the Galileo AI Agent Leaderboard's datasets to evaluate client AI agents across industries like banking, healthcare, investment, telecom, and insurance. By replicating the leaderboard's simulation pipeline, NAITIVE uses synthetic User and Tool Simulators to mimic complex, high-pressure enterprise scenarios - all while safeguarding customer data.
To measure performance, NAITIVE focuses on Action Completion (AC) and Tool Selection Quality (TSQ) scores. When TSQ scores fall short, the team applies validation layers and structured error recovery mechanisms to improve outcomes. They also rely on context summarization to maintain effectiveness during extended, multi-turn interactions.
This benchmarking process allows NAITIVE to find the sweet spot between performance and cost. For example, models like GPT-4.1-mini deliver strong results at a fraction of the cost, making them a cost-effective choice for clients looking to scale their AI operations.
Custom AI Solutions for Different Industries
Using these benchmarks, NAITIVE crafts tailored AI strategies to address the unique demands of different sectors. By analyzing model performance across industries, the agency identifies where optimization is needed. For instance, leaderboard data shows GPT-4.1 achieves a 66% AC score in insurance but drops to 58% in telecom, highlighting an 8-point gap that demands industry-specific fine-tuning.
This data-driven approach helps NAITIVE match the right model to each client’s needs. While simpler tasks may work across various models, more complex workflows require agents that score 0.85 or higher in composite tests. For example, in banking scenarios involving tasks like credit card reporting, mortgage verification, bill pay setup, and travel alerts - requiring context management across six or more distinct requests - NAITIVE selects models proven to handle these intricate, multi-step operations. This ensures clients deploy AI agents that are fine-tuned to their operational challenges.
How to Benchmark Your AI Agents
Preparing AI Agents for Evaluation
Start by defining two sets of metrics for your evaluation: technical metrics like tool selection accuracy and adherence to instructions, and business metrics such as cost savings and operational efficiency. This combination ensures your benchmarking process captures both the technical performance and its practical impact.
For datasets, follow a 70/30 approach: use 70% domain-specific data and 30% public benchmarks like MMLU or TruthfulQA. This mix keeps your evaluation relevant to your use case while maintaining comparability with industry standards. Simulate real user journeys and include edge cases where agents face ambiguous tool choices, multi-step reasoning challenges, or error recovery scenarios.
Standardize your agent setup by using a consistent system prompt, a fixed set of tools, and containerization (e.g., Docker) to ensure reproducibility. Align your evaluation with the leaderboard's core metrics: Tool Selection Quality (TSQ) and Action Completion (AC).
To evaluate subjective qualities like brand tone or helpfulness, deploy LLM-as-a-Judge using models such as GPT-4o with tailored reasoning prompts. Test edge cases deliberately, introducing missing parameters, irrelevant tools, or conflicting constraints to assess how resilient your system is under pressure. Keep a final test split untouched by prompt tuning to measure your agent's ability to generalize.
Once your agents are fully configured and tested, you’re ready to analyze their performance using leaderboard insights.
Understanding and Using Leaderboard Results
With your configurations in place, focus on the leaderboard results by prioritizing Action Completion (AC) to assess how well your agent resolves multi-turn user goals, and Tool Selection Quality (TSQ) to gauge accuracy in API calls and parameter handling. Keep in mind that performance often varies by industry - a model excelling in insurance might not perform as well in telecom.
Use leaderboard scatter plots to identify models that meet your real-time latency needs without compromising reliability. Examine failure modes, such as "Tool Miss Detection", to pinpoint areas where you may need additional guardrails or validation layers.
If your chosen model struggles with long-context scenarios - like GPT-4o-mini, which scored 0.51 in this area - consider implementing context summarization or integrating external storage systems. For models failing "Missing Parameters" tests, design workflows that prompt users to provide missing details rather than letting the agent make assumptions. This aligns with the leaderboard’s emphasis on converting technical metrics into actionable business strategies, helping you refine your AI deployment for better results.
Conclusion
The Galileo AI Agent Leaderboard is changing how businesses evaluate AI agents, shifting the focus from simple tool-calling tests to assessing real-world performance through metrics like Action Completion (AC) and Tool Selection Quality (TSQ). For instance, while GPT-4.1 achieves an average AC of 62%, enterprise-grade reliability (99% AC) is still a distant goal, projected for February 2030. This underscores the importance of accurate validation and tailored model selection.
The data also highlights key industry-specific differences and the ever-present cost-performance trade-off. A closer look reveals that GPT-4.1-mini delivers nearly comparable results to the flagship model but at a fraction of the cost - $0.014 per session versus $0.068 - amounting to a 5x cost difference for only a 6% performance gap. For enterprises scaling AI deployment, this makes cost-efficiency a critical factor in decision-making.
NAITIVE AI Consulting Agency uses these insights to design custom solutions that align technical precision with business goals. By benchmarking against industry leaders and tailoring models to specific domains, they ensure clients get agents optimized for both reliability and operational efficiency. The leaderboard’s multi-turn, synthetic scenarios also help identify potential failure points before deployment, minimizing costly production issues. This evidence-driven approach emphasizes improving Action Completion to boost user satisfaction, implementing safeguards to address the 38% failure rate seen even among top models, and guiding businesses in selecting the right agents for their needs. It transforms AI deployment into a structured, measurable process rather than a gamble.
FAQs
What metrics are used to rank AI agents on the Galileo AI Agent Leaderboard?
The Galileo AI Agent Leaderboard evaluates AI agents based on two main criteria: Action Completion (AC) and Tool Selection Quality (TSQ). AC focuses on whether an agent successfully completes a task and delivers a clear result, while TSQ assesses how well the agent selects the appropriate tools to solve a given problem.
Beyond AC and TSQ, the leaderboard incorporates four additional factors - flow, efficiency, conversation quality, and intent shifts - to gauge both user experience and operational performance. These combined metrics create a comprehensive system for comparing and improving AI agents across various industries.
How does the Galileo AI Agent Leaderboard ensure its rankings are transparent and reliable?
The Galileo AI Agent Leaderboard emphasizes transparency by openly sharing its evaluation process. It’s hosted on Hugging Face Spaces, where users can access the full dataset, scoring formulas, and evaluation code. This setup ensures that anyone can review or replicate the results. Rankings are determined using clear and measurable criteria, such as Tool-Selection Quality (TSQ) and Action-Completion (AC), with detailed scores provided for each AI agent.
To ensure reliability, the leaderboard undergoes rigorous testing with business-focused tasks across industries like banking, healthcare, and telecommunications. It evaluates agents using realistic, multi-step scenarios that reflect complex, real-world objectives. Since both the benchmark and evaluation scripts are open-source, the results are fully verifiable - offering businesses confidence in the rankings' accuracy and fairness.
What are the cost and performance differences between AI models on the Galileo AI Agent Leaderboard?
The Galileo AI Agent Leaderboard provides a clear view of how different AI models weigh cost against performance. Take GPT-4.1, for instance - it boasts the highest action completion rate at 62%, but it comes with a session cost of $0.068. This makes it a go-to choice for tasks where precision is non-negotiable.
On the other hand, GPT-4.1-mini offers a budget-friendly alternative at $0.014 per session, trading off some performance for affordability.
If you're focused on tool selection, Gemini-2.5-flash stands out with an impressive 94% tool selection quality, though its action completion rate drops to 38%. For those seeking a balance, the open-source Kimi K2 delivers a 53% action completion rate and 90% tool selection quality, all at a modest $0.039 per session.
These comparisons help developers and businesses navigate their options, finding the model that best aligns with their performance goals and budget limits.