AI Model Drift Detection: Best Practices for Enterprises
A practical enterprise guide to detecting and responding to AI model drift using metrics, tests, monitoring, alerts, retraining, and recovery workflows.

AI models don’t stay accurate forever. Over time, changes in data or relationships between variables can cause these systems to fail silently, leading to poor decisions, revenue loss, and even compliance issues.
Here’s what you need to know:
- Model drift happens in two key ways:
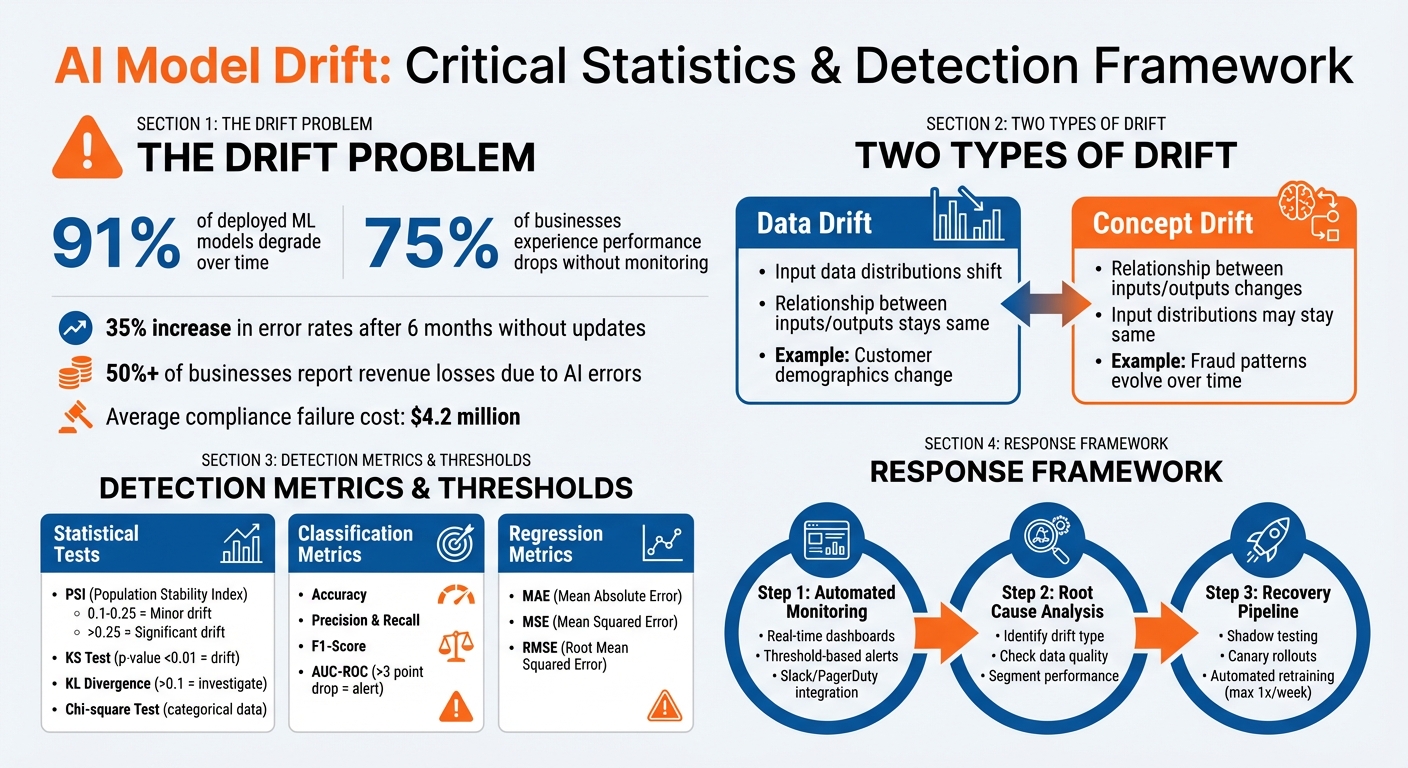
- Data drift: Input data distributions shift, but the relationship between inputs and outputs stays the same.
- Concept drift: The relationship between inputs and outputs changes, like fraud patterns evolving over time.
- 91% of deployed models degrade, and without monitoring, 75% of businesses experience performance drops.
- Use tools like statistical tests (e.g., PSI, KS Test) and performance metrics (e.g., accuracy, F1-score) to track drift.
- Set up automated alerts, real-time dashboards, and retraining workflows to quickly address issues.
- Recovery strategies like shadow testing, canary rollouts, and incremental learning can reduce risks when updating models.
Ignoring model drift can lead to 35% more errors in just six months. By combining detection methods, monitoring systems, and retraining processes, you can maintain model performance and avoid costly mistakes.
AI Model Drift Statistics and Key Metrics for Enterprise Detection
Data Drift vs Model Drift in Machine Learning Causes, Detection & Prevention Explained
Checklist: Metrics and Tests for Detecting Model Drift
Detecting model drift involves using statistical tests to monitor input data and performance metrics to assess output quality. These tools are part of a larger drift management framework, tailored to your model type and how quickly ground truth labels become available. Implementing these requires robust workflow automations to handle data ingestion and alerting. When actual outcomes are delayed - like fraud chargebacks requiring 30 days for confirmation - early indicators can help identify issues before performance noticeably declines.
Statistical Tests for Input Data Drift
- Population Stability Index (PSI): This measures shifts in input data distribution against a stable baseline. It's lightweight and works for both continuous and categorical features. PSI values between 0.1 and 0.25 suggest minor drift, while values above 0.25 indicate more pronounced shifts.
- Kolmogorov-Smirnov (KS) Test: Designed for continuous variables, this test calculates the maximum distance between two cumulative distribution functions. A p-value below 0.01 signals significant divergence between production and training data.
- Chi-square Test: Ideal for categorical data, this test compares production frequencies to the training baseline to detect changes.
While these tests focus on input data, performance metrics reveal the downstream impact on model predictions.
Performance Metrics for Output Drift
For classification models, metrics like accuracy, precision, recall, F1-score, and AUC-ROC are key to identifying shifts in prediction quality. For regression models, metrics such as Mean Absolute Error (MAE), Mean Squared Error (MSE), and Root Mean Squared Error (RMSE) help measure deviations from actual values. For example, a drop of more than 3 points in AUC often triggers further investigation.
When ground truth data is delayed, monitoring distributions of predicted scores or classes can provide early warnings of performance issues.
"Measurements of performance degradation are more important than drift statistics. For example, our fraud detection accuracy fell 3% in two weeks, even though drift looked minor by PSI." – Mircea Dima, CTO at AlgoCademy.
In addition to these metrics, divergence measures can capture subtle shifts in data distribution.
Using Kullback-Leibler Divergence
Kullback-Leibler (KL) Divergence is a method for detecting subtle distribution changes, especially in the tails of the data. A KL divergence score above 0.1 typically signals meaningful shifts that merit further investigation. However, since KL divergence is asymmetric, reversing the baseline and sample distributions can alter the results. It works best for categorical features with 50 to 100 unique values. Beyond this range, the signal can become too noisy.
When using KL divergence, apply it to individual features and handle bins with zero samples carefully to avoid errors. While many organizations prefer PSI for its symmetry and ease of comparison, KL divergence is invaluable for detecting early, subtle shifts.
These tools and metrics are essential for setting up automated alerts and dashboards to ensure continuous monitoring of model drift.
Checklist: Setting Up Monitoring and Alert Systems
To keep your models performing well, it's crucial to have a monitoring system that alerts your team when drift metrics cross critical thresholds. Real-time monitoring is key - delays, even short ones, can lead to significant financial consequences.
Configuring Automated Thresholds and Alerts
Start by identifying the metrics you need to track. This could include input feature drift (covariate shift), output inference drift (prediction shift), or shifts in feature importance. Use your training data or a stable historical production window to establish a baseline. Then, choose statistical distance metrics that fit your data type. For example, Kolmogorov-Smirnov or Jensen-Shannon divergence works well for numerical data, while L-infinity or Chi-square tests are better suited for categorical data.
Set numerical limits for these metrics to trigger alerts when exceeded. Make sure thresholds are tied to business impact to avoid excessive notifications. For instance, Vertex AI Model Monitoring uses a default threshold of 0.3 for both categorical and numerical features. As the Statsig team puts it:
"Retrain because outcomes have slipped, not because a histogram moved".
If you’re working with high-volume applications, consider sampling only a percentage of requests instead of monitoring everything. Use a sliding window approach to analyze data in smaller, manageable batches. Integrate your monitoring system with tools like Slack, email, SMS, or PagerDuty to ensure quick responses.
Don’t stop at statistical drift. Add rule-based constraints to catch data quality issues, like schema violations, high percentages of missing values, or anomalies (e.g., a "price" feature showing negative values). Focus on high-impact features, as small drifts in these can be more damaging than larger shifts in less critical ones.
Once your alerts are set, consolidate all insights into real-time dashboards for better visibility.
Creating Real-Time Data Dashboards
Dynamic dashboards complement alert systems by making drift trends and operational health easier to track. Build unified dashboards that combine statistical tests with performance metrics for a complete view of model health. Tailor the dashboards for different audiences: detailed drift scores for engineers, latency and error rates for operations teams, and high-level summaries for business leaders.
Key visualizations could include:
- Time-series plots for drift scores (e.g., PSI or Kolmogorov-Smirnov)
- Histograms comparing reference and production data
- Performance metric plots like AUC and F1-score
Quadrant charts are particularly helpful for correlating feature importance with drift. This makes it easier to prioritize issues in features that are both highly important and experiencing significant drift. Include operational health metrics like CPU/GPU usage, request latency, and throughput alongside model-specific metrics for a complete system overview. As ApX Machine Learning explains:
"An effective dashboard translates potentially complex, high-volume data streams into clear visual summaries, enabling rapid assessment of system health and trend identification".
For metrics that naturally fluctuate, use adaptive thresholds based on rolling statistics. For example, alert if a score exceeds three standard deviations from the rolling mean. This approach minimizes false positives caused by normal variability.
Establishing Reference Windows for Comparison
A solid baseline is essential for detecting drift effectively. Reference windows act as this baseline, allowing you to compare current production data against a known stable period. Start with your training dataset to establish the normal range of feature distributions and target variables. For deployed models, select reference windows from times when the model performed reliably. Make sure these windows are large enough to account for seasonal patterns and provide a statistically significant sample.
Your baseline should also reflect the system’s current context. For instance, data from a monolithic architecture might not be suitable for a microservices environment. Use sliding windows to compare recent production data with historical periods, capturing both gradual and sudden shifts. After each model update, reset the reference window. If your application serves different user segments, create distinct reference windows for each group (e.g., geographic locations or device types) to spot localized drift.
Finally, avoid overlap between your reference and production data windows. Set the reference lookback window offset to be at least the sum of the production window size and its offset. This ensures your baseline remains uncontaminated by the data currently under evaluation.
Checklist: Responding to Model Drift
When your monitoring system detects drift, having a solid response plan is crucial to maintaining model performance without disrupting operations. The challenge lies in acting quickly while ensuring thorough analysis - after all, 91% of machine learning models degrade over time, and models left untouched for six months or more can see error rates spike by 35% on new data.
Setting Up Automated Retraining Workflows
Automating retraining can save time and help your model adapt faster. Start by capturing real-time data from all production endpoints, including inputs and predictions. Use your original training dataset to set baseline metrics.
Define retraining triggers based on your business needs. Combine time-based schedules (e.g., weekly or monthly) with performance-based alerts like accuracy drops or distribution changes. Tools like Amazon CloudWatch can monitor these metrics, while EventBridge rules can kick off retraining pipelines automatically.
Your automated workflow should handle data preprocessing, model training, and evaluation. Before deploying any updates, compare the new model's metrics (e.g., RMSE, F1-score, AUC) with the current production version. If the new model underperforms, halt the process to avoid introducing further issues. Register successful models in a centralized system, noting key details like version, training date, hyperparameters, and the data used.
A hybrid retraining strategy works well for balancing gradual updates with sudden adjustments. You can retrain periodically while also responding to immediate changes. For better adaptation, give more weight to recent data (e.g., the last three months) during retraining. To avoid overloading resources, set a minimum retraining interval - once a week is a good starting point.
Once retraining is automated, focus on identifying and addressing the root cause of the drift.
Conducting Root Cause Analysis
Understanding the source of drift is essential. As James Croft from Microsoft puts it:
"Model drift is not a technology problem; it is a change in the context of data that can be effectively managed by implementing effective analysis of the data they are trained on".
Start by identifying the type of drift. Is it data drift, where input feature distributions have shifted, or concept drift, where the relationship between inputs and target variables has changed? Use statistical tests like PSI, Kolmogorov-Smirnov, or Jensen-Shannon Divergence to pinpoint which features have shifted.
Focus on features with the highest impact first. Even small changes in predictive features can have a larger effect than significant shifts in less important ones. Tools like SHAP can help assess whether feature contributions to predictions have changed, offering insights into explainability-related drift.
Before retraining, rule out pipeline failures. Check for silent issues like sensor errors, schema changes, or problems with third-party data feeds. Monitor data quality metrics such as missing values, unexpected new entries, or cardinality shifts to detect these issues. If ground truth labels are delayed (e.g., fraud chargebacks), use feature drift and prediction drift as proxies for monitoring performance.
Look for patterns in errors to see if issues are localized. Segment performance metrics by factors like geography, customer demographics, or device type to identify specific problem areas. Document your findings thoroughly - especially in regulated industries, where compliance failures can cost an average of $4.2 million.
After identifying the cause, use recovery pipelines to update models with minimal disruption.
Implementing Recovery Pipelines
Recovery pipelines are essential for ensuring smooth updates when addressing drift. Use staged release strategies to reduce risks. For example, shadow testing runs the new model alongside the current one without affecting users, while canary rollouts expose the update to a small group incrementally. Champion/challenger setups compare multiple models against the production version to find the best performer.
To ensure stable performance, implement slice-level gates that check critical segments before full deployment. Always have a rollback plan ready, with clear criteria for reverting to the previous model if needed.
During recovery, maintain operational stability using automated scaling and multi-availability zone deployments for production endpoints. Keep data capture active to monitor the new model's real-time performance. Limit retraining frequency to once a week unless there’s an urgent need.
Choose the retraining approach based on the situation:
- Full retraining is ideal for significant concept drift or major architecture changes, though it’s resource-intensive.
- Incremental learning updates model weights with recent data (e.g., the last 7–30 days). It’s faster but risks forgetting older patterns.
- Fine-tuning adapts the model to specific changes while preserving general patterns, but requires careful regularization to avoid performance issues.
Checklist: Tools and Implementation Practices
After setting up automated metrics and alert systems, the next step is selecting tools and building collaboration to manage drift effectively. The tools you choose should balance robust technical capabilities with smooth integration into your existing infrastructure. Below, we’ll explore some tools and practices that complement the monitoring and alert systems discussed earlier.
Evidently AI, an open-source Python library, comes with over 50 metrics, including PSI, KS tests, and evaluations tailored for large language models (LLMs). Fiddler AI focuses on explainability and monitoring, especially in cases where ground truth data is delayed. Domino Model Monitor provides a centralized dashboard that supports cross-team workflows, including retraining triggered via APIs. Alibi Detect is known for its statistical algorithms aimed at detecting outliers and adversarial inputs. For those looking for managed solutions, platforms like Arize and WhyLabs offer pre-built observability tools.
Comparing Drift Detection Tools
When evaluating drift detection tools, it’s essential to choose ones that cover both statistical drift (using metrics like PSI and KS tests) and semantic analysis for LLMs. These tools should seamlessly integrate into your MLOps stack, including logging layers, feature stores, and metric stores, and should be capable of triggering automated retraining workflows when drift thresholds are breached. As Ashley Scillitoe from Seldon explains:
"Drift detection is critical for keeping your machine learning pipelines performing. Ultimately, it all goes back to trust".
Good tools also provide detailed insights to pinpoint underperforming segments or corrupted features. For instance, standard thresholds such as PSI > 0.25, KS p-value < 0.01, or KL Divergence > 0.1 can signal drift. For performance metrics, a drop in AUC exceeding 3 points or an Expected Calibration Error above 0.05 should prompt further investigation.
Enabling Cross-Team Collaboration
Effective drift management requires shared responsibility across teams. IT or ML engineers can oversee infrastructure and pipeline health, data scientists can focus on analyzing drift, and business stakeholders can monitor the impact on key performance indicators (KPIs).
Start small with a two-week pilot on a high-value model. During this period, monitor 5–10 critical features and 3–5 business segments. Use representative data from training or consistent production periods to establish stable baselines. Version-control your monitoring configurations alongside model code to allow rollbacks and maintain auditability. APIs can be used to feed data into monitoring systems and trigger workflows automatically when drift thresholds are crossed.
By coordinating tool use and fostering collaboration, organizations can create a unified and efficient monitoring environment.
Creating Centralized Monitoring Environments
Centralized monitoring consolidates drift management practices, offering continuous oversight and a quick response to issues. A "single pane of glass" approach provides a unified view of model health across the organization. This setup should include three key layers: data health (input distributions), model performance (accuracy and latency), and infrastructure health (uptime and resource usage). Such a system helps eliminate information silos and ensures smooth collaboration between teams.
Standardized metrics like PSI, KL Divergence, and KS tests should be applied across all models to ensure consistency in how drift is measured and reported. Automated thresholds can trigger alerts through incident-management tools like Slack or PagerDuty. For organizations using cloud-native tools such as SageMaker within a custom VPC, setting up VPC endpoints ensures secure communication between monitoring systems. Additionally, keeping disk utilization below 75% can prevent silent failures in monitoring.
For teams with limited resources, managed services like Fiddler or Domino can reduce the complexity of maintaining integrations in production. Begin with basic data quality checks and expand to more advanced drift detection as your MLOps processes mature. Tracking business metrics alongside technical ones helps assess the broader impact of model degradation, while using multiple validation methods minimizes false alarms and reduces alert fatigue.
Conclusion: Key Takeaways for Model Drift Management
Model drift is inevitable. Studies reveal that 91% of machine learning models degrade over time, and 75% of businesses encounter performance drops when proper monitoring isn't in place. The key to maintaining performance lies in combining strong detection methods with swift responses.
Start by establishing clear baselines using training data and reliable production periods. Monitor drift across various layers with tools like statistical tests (e.g., PSI, KS test), performance metrics (e.g., accuracy, F1-score), and KPIs that directly impact revenue. For instance, a PSI value exceeding 0.25 should prompt immediate investigation. Ignoring these signs can lead to significant error rate increases in models left unchanged for too long.
Automation plays a critical role here. Set up systems to send alerts - via Slack, PagerDuty, or similar tools - when thresholds are breached. Pair these alerts with hybrid retraining workflows that blend scheduled updates with event-driven adjustments. As Bob Laurent from Domino Data Lab puts it:
"Model monitoring is a vital operational task that allows you to check that your models are performing to the best of their abilities".
Beyond automation, fostering collaboration across teams is essential. When IT, data scientists, and business stakeholders share accountability for model health through centralized monitoring platforms, organizations can respond more efficiently and effectively.
The steps outlined above are designed to protect your models from drift. Ignoring these practices can be costly - over 50% of businesses report revenue losses due to AI errors. By implementing these measures, you not only safeguard your AI systems but also enhance trust and maintain your competitive position. For those seeking expert guidance on advanced drift detection strategies, NAITIVE AI Consulting Agency (https://naitive.cloud) offers specialized support.
FAQs
How do I tell data drift from concept drift in production?
Data drift happens when there are changes in the distribution of input data, such as shifts in feature values or topics over time. On the flip side, concept drift refers to changes in the relationship between inputs and outputs, which can make a model's learned patterns or rules less effective. Keeping an eye on both is crucial to ensuring your model continues to perform as expected.
What should I do when labels arrive too late to measure accuracy?
If labels take too long to arrive for accuracy checks, try proactive monitoring instead. By using statistical tools or performance metrics, you can catch signs of model drift early. This approach helps you tackle potential problems without having to wait for delayed labels, keeping your model running smoothly and reliably.
How do I set drift alert thresholds without creating alert fatigue?
To keep alert fatigue in check, it's important to set thresholds that strike the right balance between sensitivity and specificity. Focus on identifying major deviations that could impact your model's performance. Use automated tools to keep an eye on data drift, distribution shifts, and concept drift - these are key indicators of potential issues.
Consider using adaptive thresholds that adjust based on historical data and performance metrics. This can help fine-tune alerts to be more relevant. Regular reviews and adjustments to these thresholds ensure they stay effective over time. Additionally, customizable alerting rules can make sure you’re notified only for meaningful drift events, avoiding unnecessary noise.